The Automation Summary menu provides you a summarized view of the Transaction details, AHT details and machine utilization of the machines allocated for the project. The menu has 3 grids,
- Transaction View
- Queue wise AHT
- Machine utilization
To access this feature navigate to Dashboard à Automation Summary
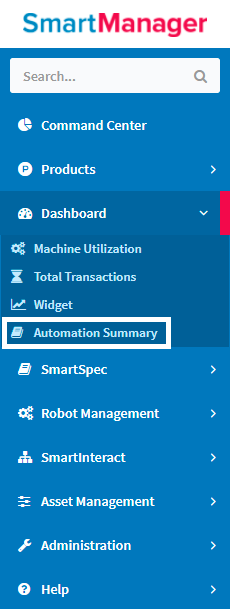
Figure 1
Details that get populated in each of the grids mentioned above is based on the filter options chosen by the user. The filter options are environment, program, project, start date and end date.
Click on “Filters” to choose the filter options.
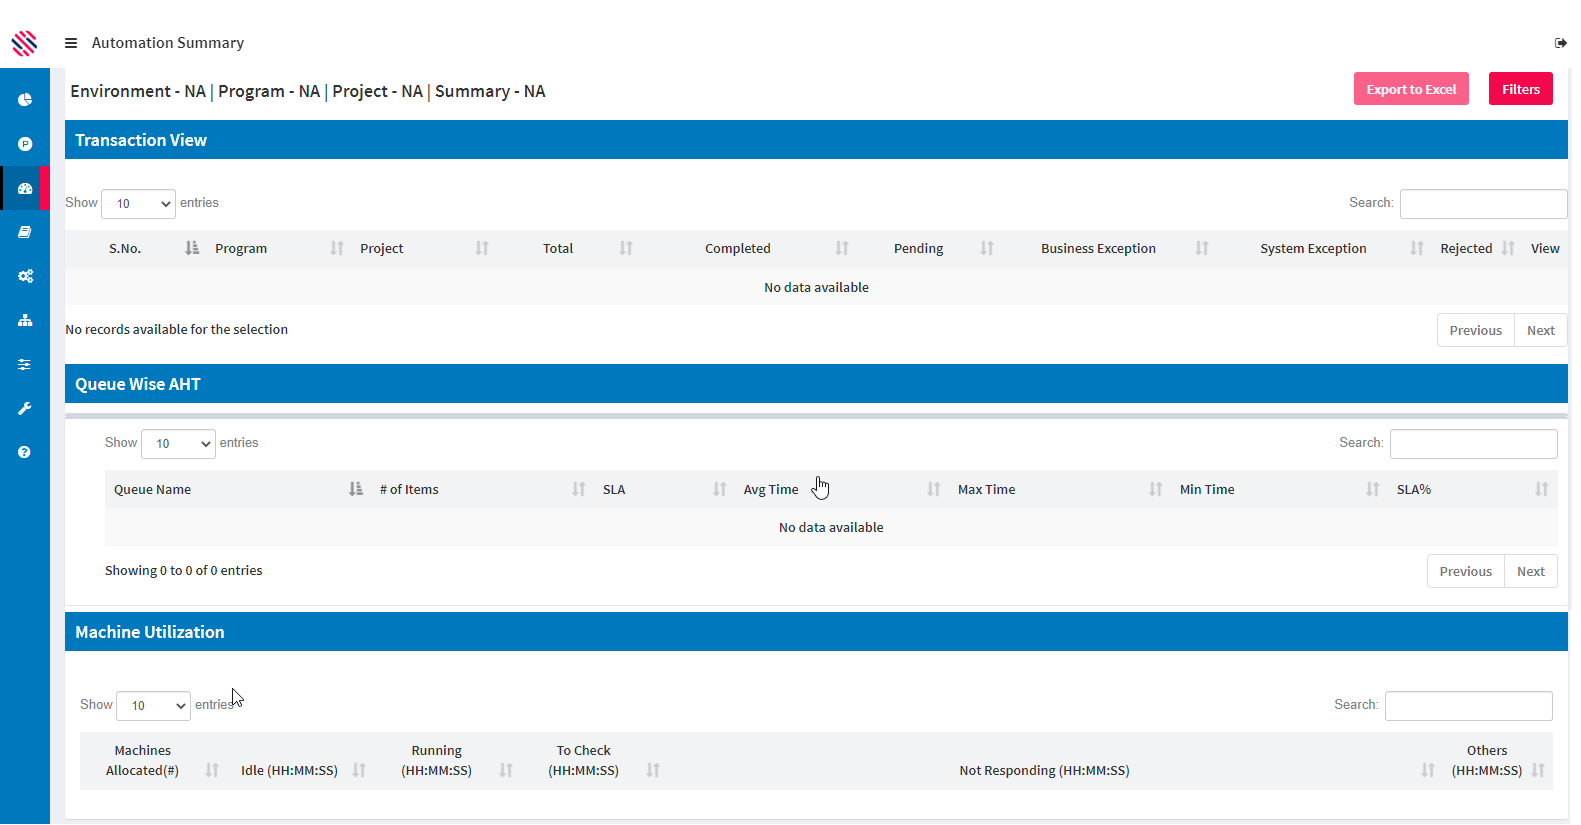
Figure 2
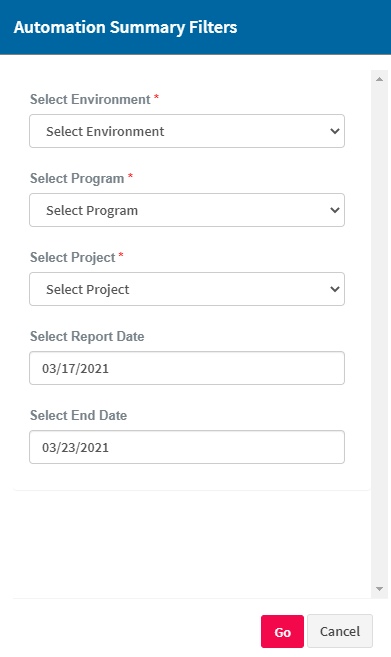
Figure 3
Choose the preferred environment, program, project and the start and end date and click “Go”.
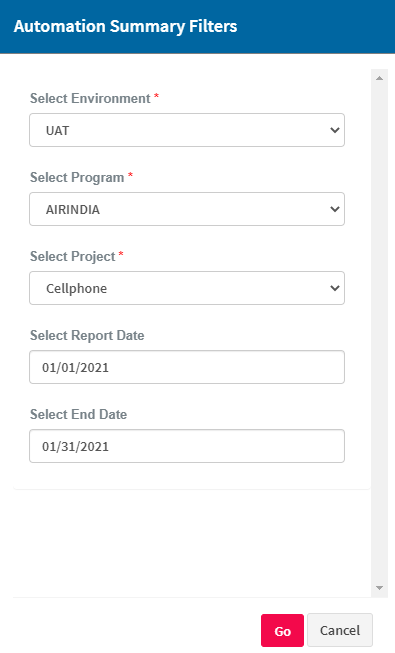
Figure 4
Note: The time period does not have limitation (User can choose more than 30 day period)
Transaction View:
Transaction view grid holds the project level transaction split. Total transaction, pending transactions, business exception, system exception and the number of transactions rejected are the details shown on the grid.
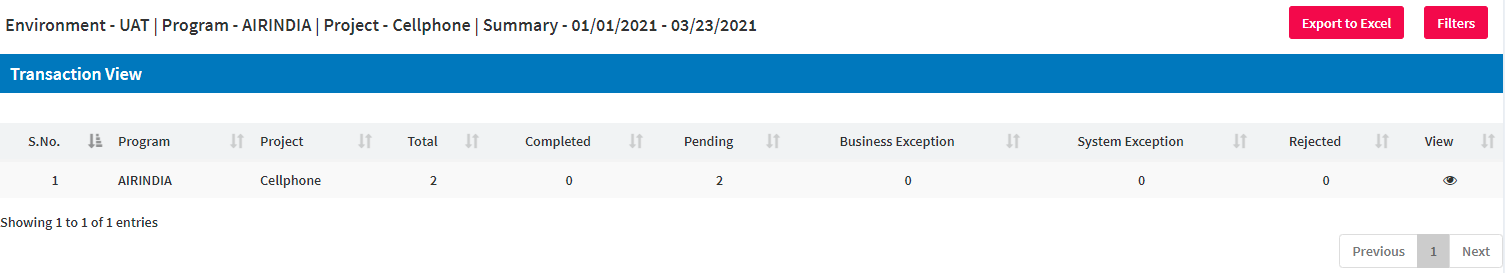
Figure 5
Adjacent to the rejected count the eye icon under the View column on clicking pops up a window with the list of transaction with an additional field “created date” field.
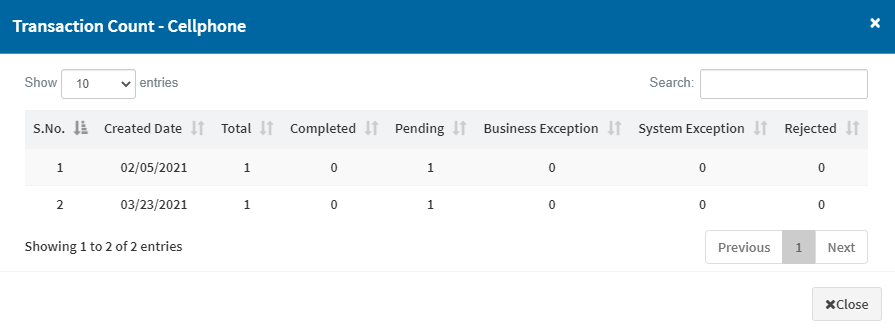
Figure 6
Queue Wise AHT:
This grid displays the average handling time to process transaction in each queue configured in the project, number of transaction that are overdue to be processed along with the percentage of transactions that met the defined SLA for each queue. In addition, maximum and minimum time taken to process the transaction is available.

Figure 7
Machine Utilization:
Machine utilization summarizes the utilization details of the machines that has been allocated to the project. The grid provides the status level split of time with spent against each machine status that we have in our system.
The time displayed against each field is the sum of all the allocated machines remaining in the particular state for the period chosen by the user in the filter.
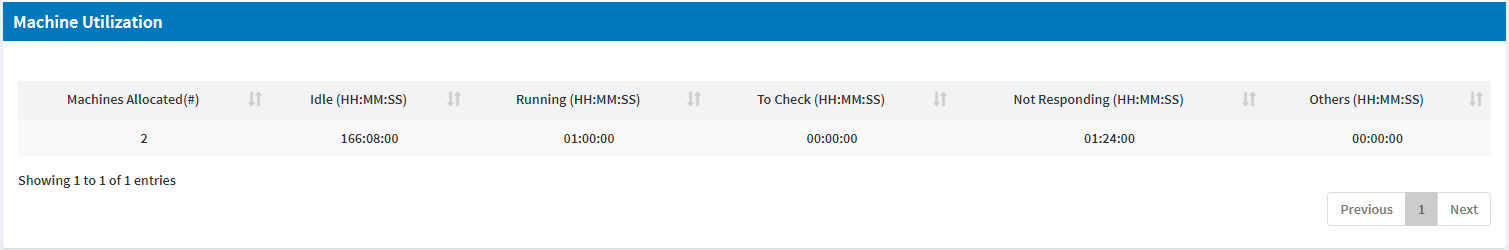
Figure 8
Export To excel:
The export to excel file helps you to export the data in the grid to an excel file. In this menu, when the user clicks on “Export to Excel” option, three excel files gets opened one which contains the Transaction Summary, one with the Queue wise AHT data and the third one with the Machine utilization data.
Note:
The owner of the project and the Process admin group will receive a mail daily keeping them informed with the Transaction summary, Queue wise AHT and Machine utilization information of the project for the day.