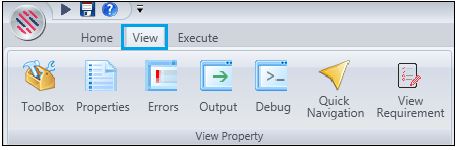
The view tab provides access to the Toolbox, Properties, Error, Output, Debug, Quick navigation and View Requirement menus. A detailed walk-through follows.
Figure 1
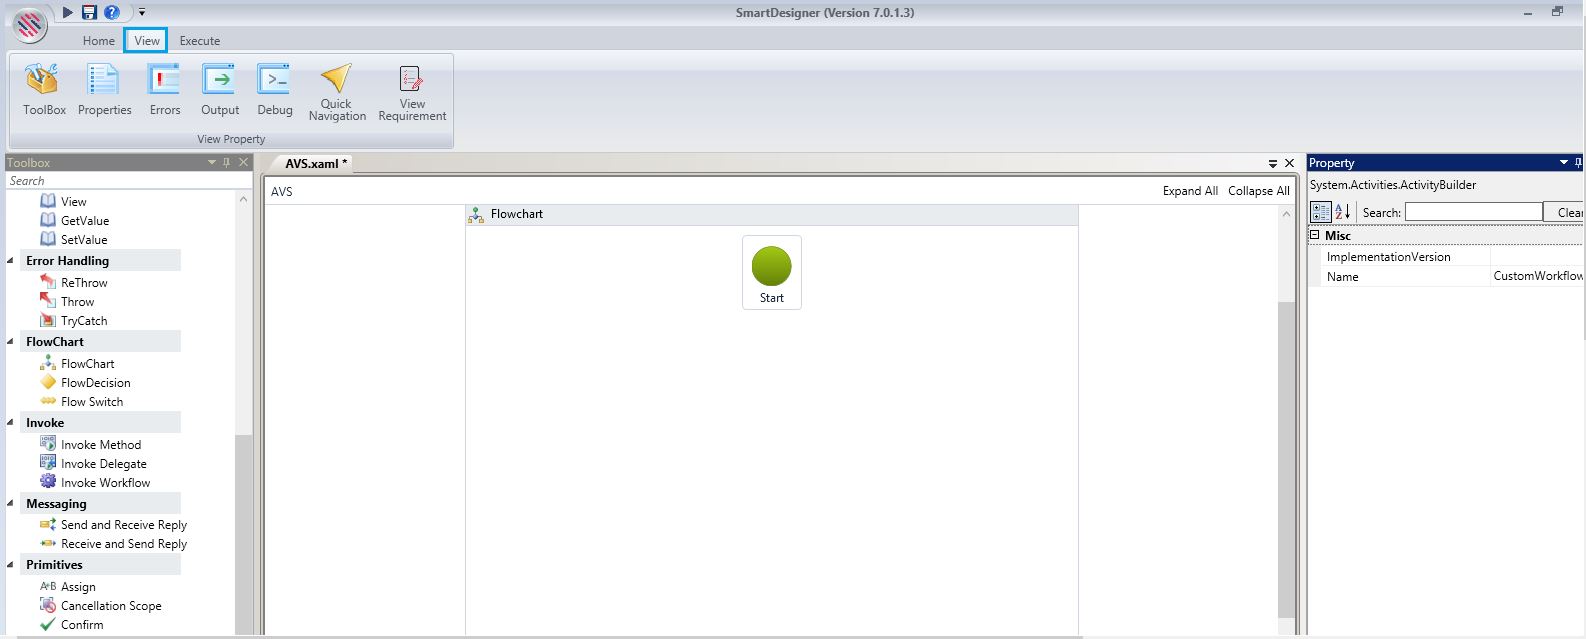
Figure 2
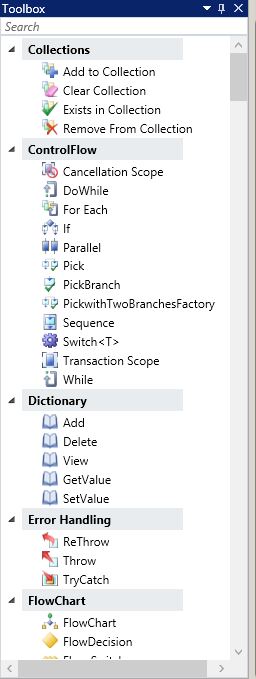
Toolbox
Clicking on this menu will enable the activities under the toolbox pane. There are 150 plus activities that the user can avail to create robust robots. These are drag and drop activities and no programming skills is required to use these simple yet proficient activities. Horizontal and vertical scroll bars can be used for easy navigation.
Figure 3
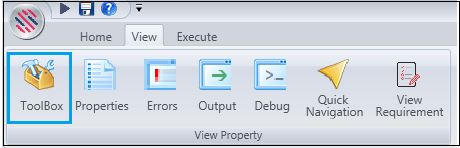
Figure 4
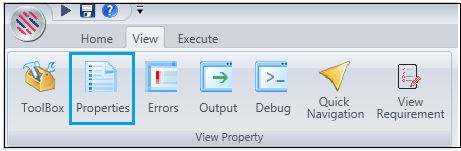
Properties
Figure 5
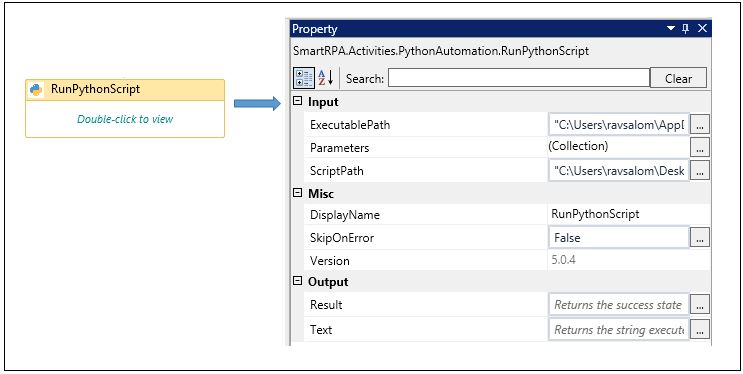
For each activity, a different property window will be enabled. You will be required to fill in details accordingly to execute the activity. Display name will be auto populated, and you can change it. You have options to provide the various variable types, such as String, Boolean value, etc. You also have an option to provide the Path based on requirements of the activity. For some fields you also have dropdowns to select values.
Figure 6
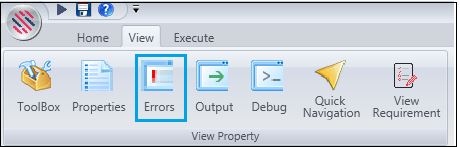
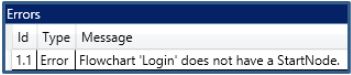
This menu will display the errors window.
Figure 7
After execution, if the workflow is not completed successfully due to errors, those errors will be displayed in the output field. If the user is working with multiple workflows and happens to close the output field of the erroneous workflow because he is required to work on another flow, but later wants to check the errors that he had closed, the user can click on the Error window and the last execution’s errors for any given workflow is displayed. Thus, it facilitates instant and easy detection and resolving the issue, instead of searching for errors at every step of the workflow. Refer the following image.
Figure 8
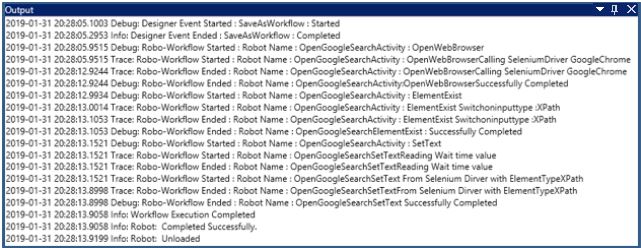
The Output Window displays the footprints of the workflow that is executed, based on the log levels that has been chosen by the user.
Figure 9
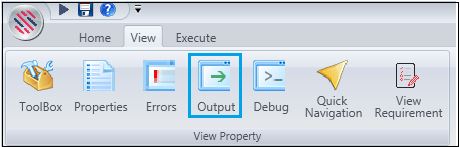
Figure 10
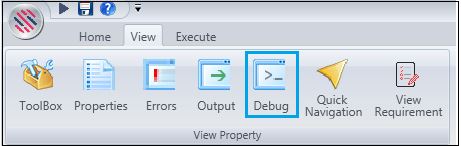
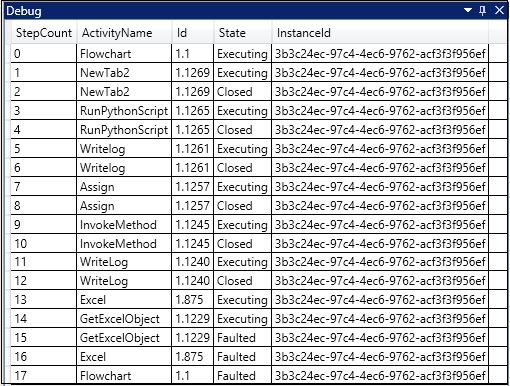
The Debug window is provided for debugging in order to run the target workflow under controlled conditions that permits you to track its operations in progress and monitor changes that may indicate malfunctioning code.
Figure 11
You can view the debugged results in the Debug window.
Figure 12
The Quick Navigation Window Option
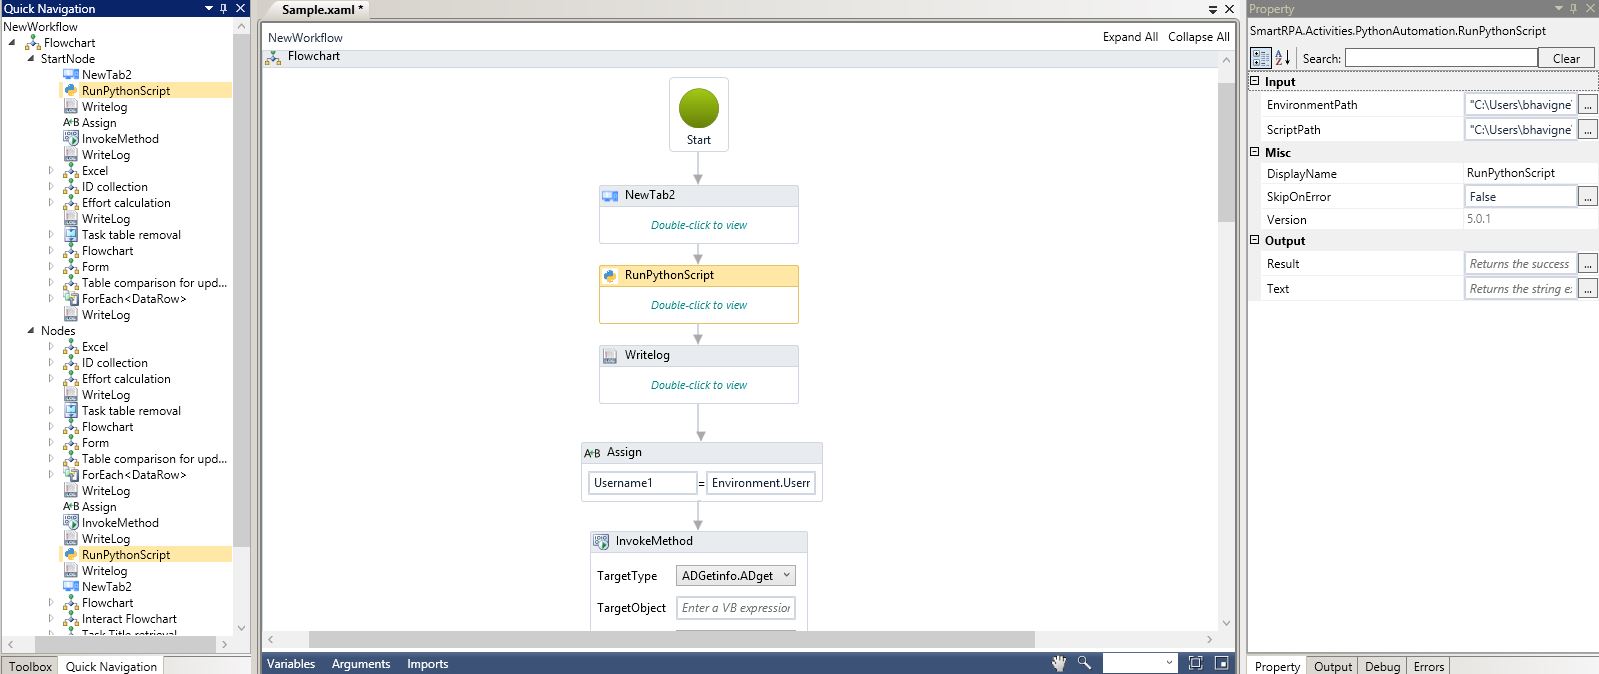
The Quick navigation menu displays the quick navigation window.
Figure 13
Thus, the Quick navigation option facilitates navigating to a specific activity or a part of the workflow, instantaneously. This is particularly helpful in the event of maneuvering through a complex workflow, since it displays the workflow hierarchy. This helps in easy navigation through multiple steps in the workflow for swift and easy identification of activities. Clicking on the chosen action displays the corresponding activity's properties.
Figure 14
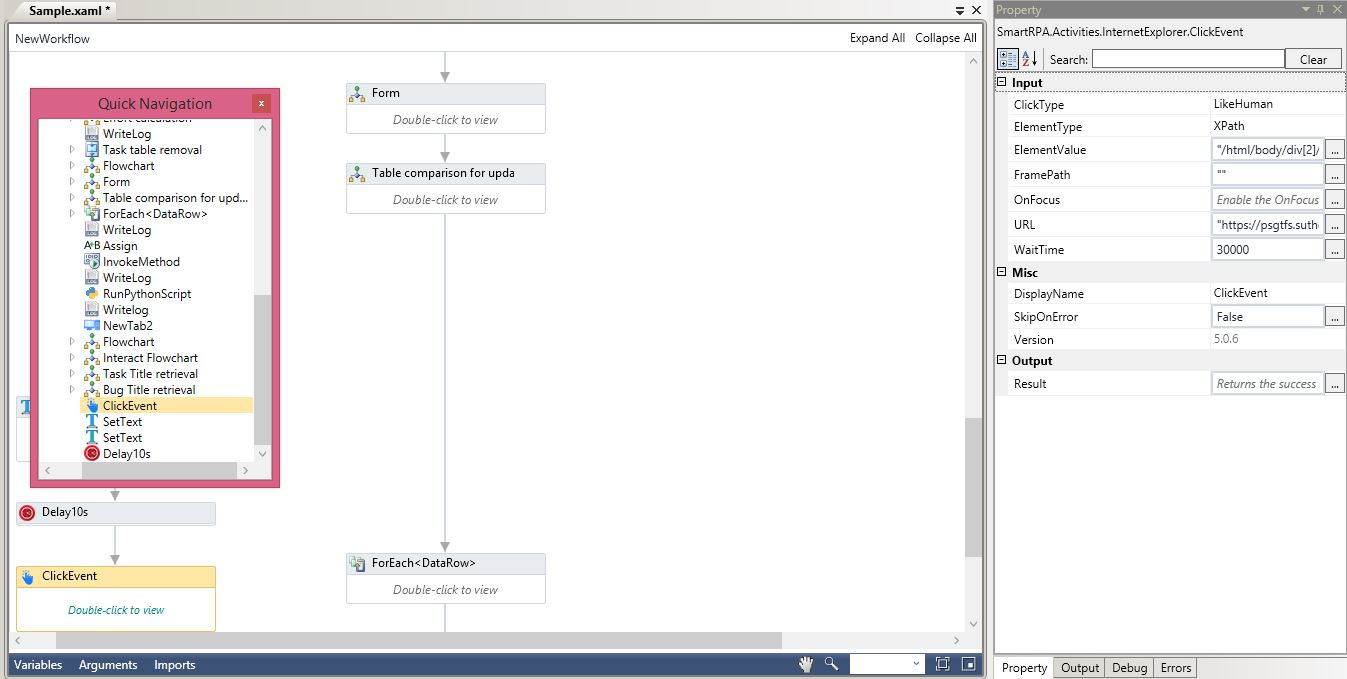
Using the float option, you can get a closer view with similar action.
Figure 15
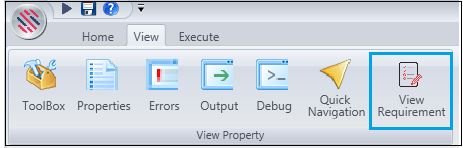
View Requirement
If you want to view the Requirement Document, you can use this menu.
Figure 16