The Sentinel.AI Dashboard contains these charts to indicate the anomalies that are detected by Vision and un-masking events that are made ys users of Sentinel.AI Shield module.
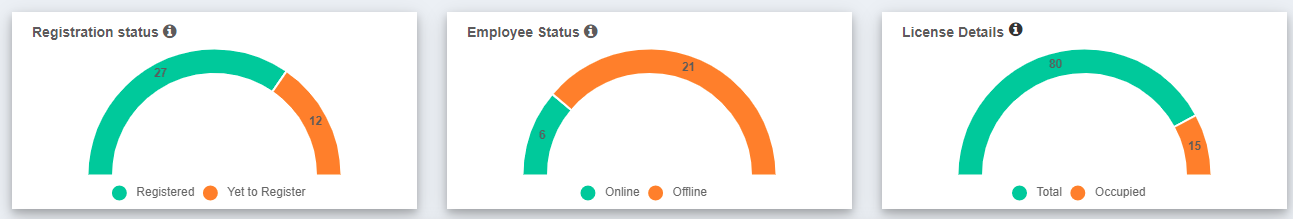
Registered users in the platform is available were a platform user can get an idea on the total number of users who have completed the registration process to use the platform.
Employee status – Here you can see the on-line status of the Sentinel.AI application on the end point.
License details – Total allocated licenses vs utilized.
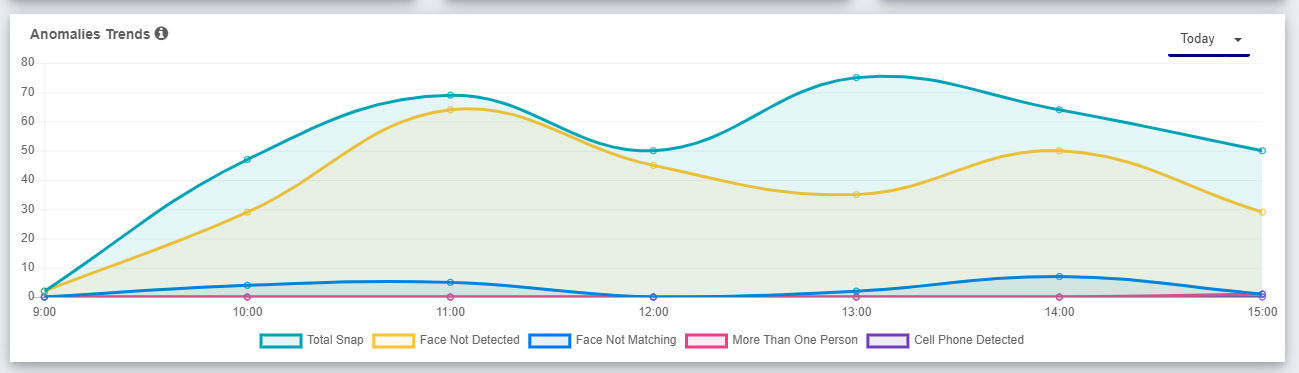
Anomalies trend - For Sentinel.AI Vision users only
Provides a consolidate view of anomalies detected over the duration of the shift. Aditionally, hisorical view for anomalies can be accessed via duration filter.
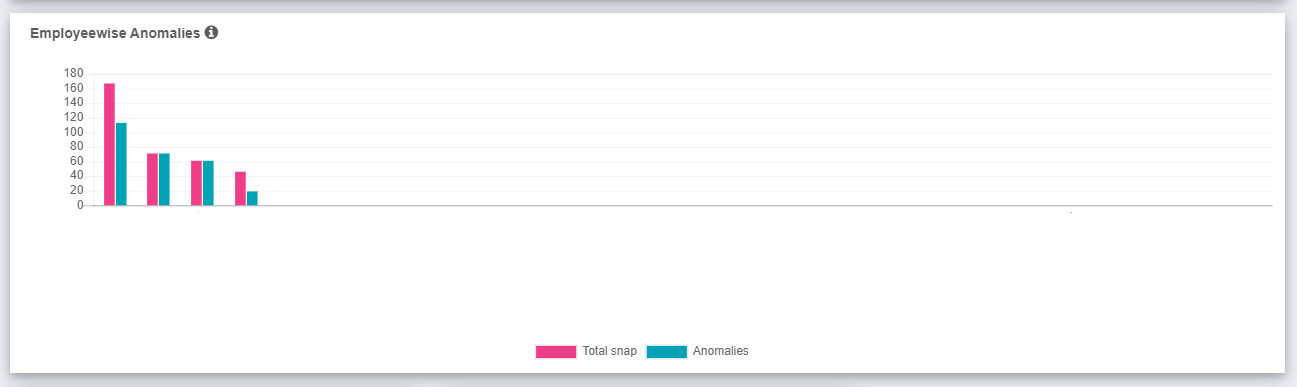
Employeewise anomalies - For Sentinel.AI Vision users only
Shows the count of anomalies detected for agents on shift.
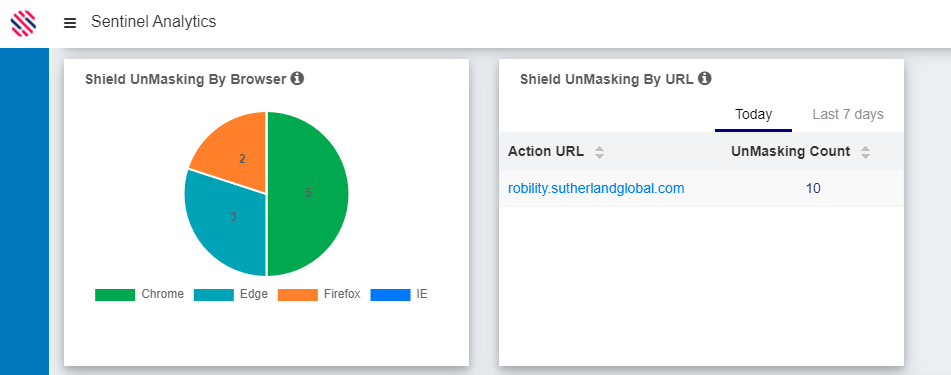
Un-making by browser – For Sentinel.AI Shield users only
Current un-masking events can be viewed by different web browsers
Un-making by URL – For Sentinel.AI Shield users only
Current and historical data (last 7 days) for un-masking events by URL
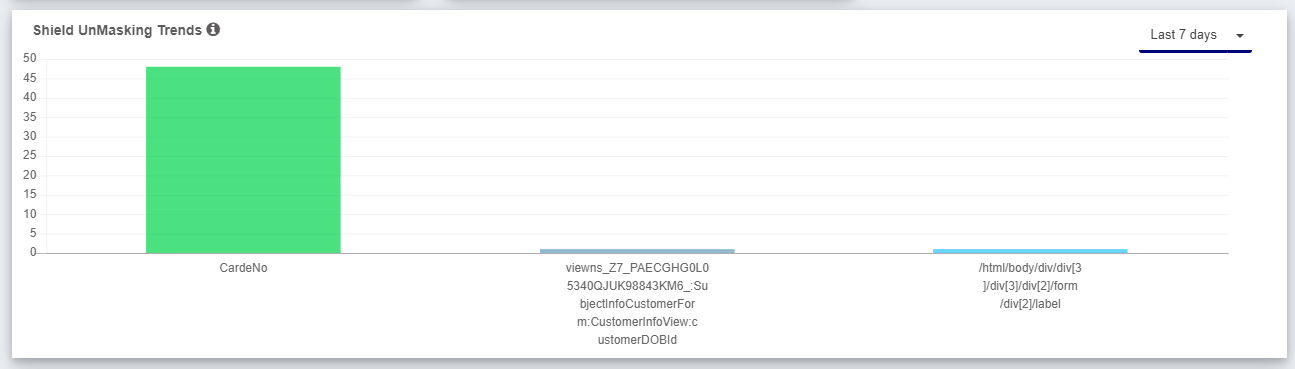
Un-masking Trends – For Sentinel.AI Shield users only
Current and historical (Last 3 months) un-masking data by browser name
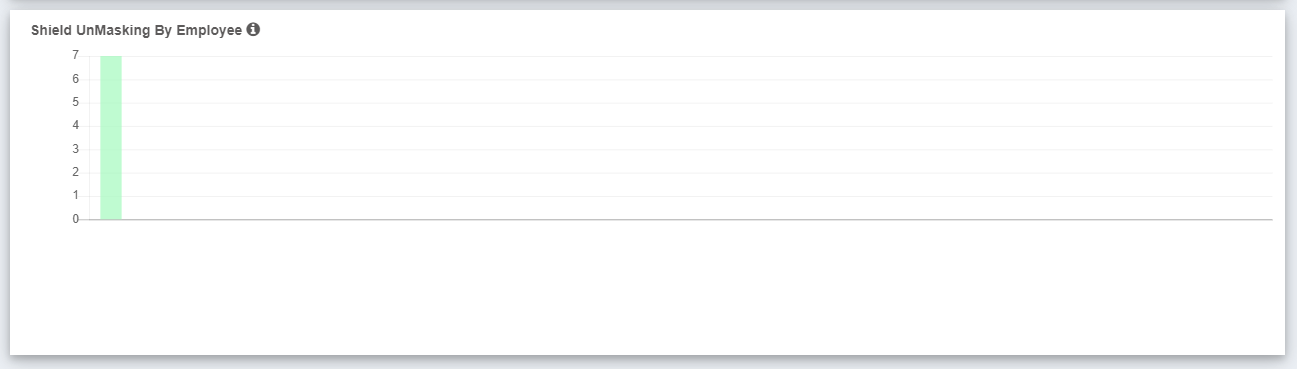
Un-masking By Employee – For Sentinel.AI Shield users only
Current and historical un-masking events made by employee.