This activity assists in displaying the records of the "datatable" in a tabular format.
It is useful for debugging purposes, enabling users to review the values within the
"datatable" before the workflow progresses. This helps in identifying errors or
incorrect data within the datatable.
Technical Reference
|
|
INPUT |
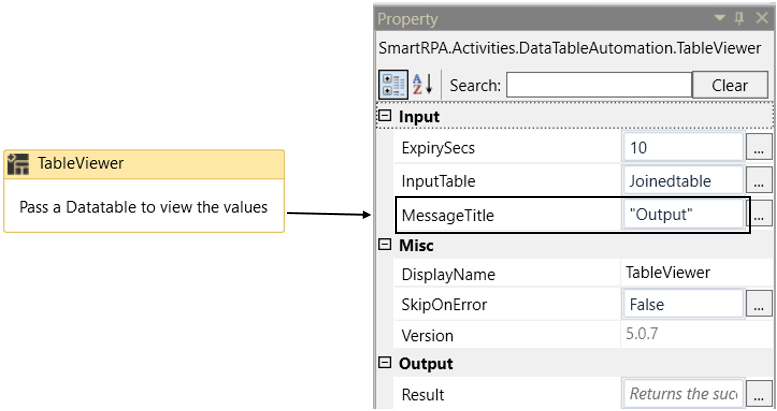
ExpirySecs: Indicate the duration in seconds for which the dataset table should be displayed. Provide the time value in seconds. The default setting is “5 seconds.” This field only accepts the "Integer32" datatype. |
|
InputTable: Enter the "Input datatable" variable where the input data is stored. This parameter helps you to view the “datatable”. This field only accepts the "datatable" data type. |
||
|
MessageTitle: Specify the “Title” for the “Dataset” table. This field accepts only “String” datatype. |
||
|
MISC |
DisplayName: Displays the name of the activity. The activity name can also be customized to help in troubleshooting. |
|
|
SkipOnError: It specifies whether to continue executing the workflow even if it throws an error. This supports only Boolean value “True or False”. By default, it is set to “False.” True: Continues the workflow to the next step None: If the option is specified as blank, by default the activity will perform as “False” action. |
||
|
Version: It specifies the version of the Datatable automation feature in use |
||
|
OUTPUT |
Result: It helps to view the execution state of the activity. It returns the values in Boolean format. True: It indicates the activity has been executed successfully without any error. False: It indicates that the activity has been faulted due to some unexceptional error thrown. |
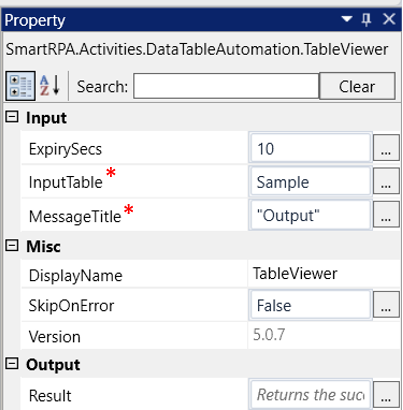
* Represents mandatory fields to execute the workflow.
Here's an example of how the TableViewer activity works –
In the following example, I am using the “Excel sheet” which is used to automate in the
Use case. To get a better understanding, click here.
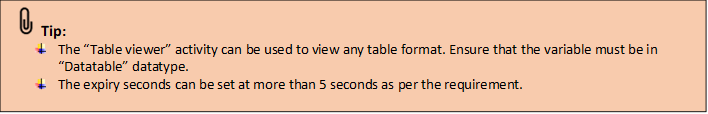
1. Drag and drop the " TableViewer " activity onto the designer pane.
a. It helps to view the “datatable” in a table format.
b. Here I am extracting the output as “Datatable” from the “Excel sheet”
using the “ReadRanges” activity from the “Excel Automation.”
(Refer the Use case to get detailed information).
i. “JoinedTable” is the output for the “datatable” which is
declared here.
c. Navigating to the “ExpirySecs” from the properties of the “TableViewer” activity.
i. Here, the default secs is set to “5”. And I am increasing the
time value as “10”.
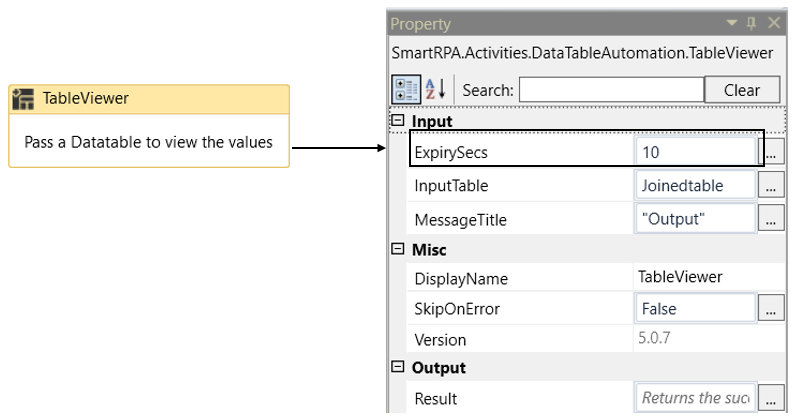
d. Then moving to the “InputTable” property to provide the input datatable.
i. Here I am using the datatable “JoinedTable” extracted as output from the
“Excel sheet”.
e. Next Moving to the “Title” from the properties.
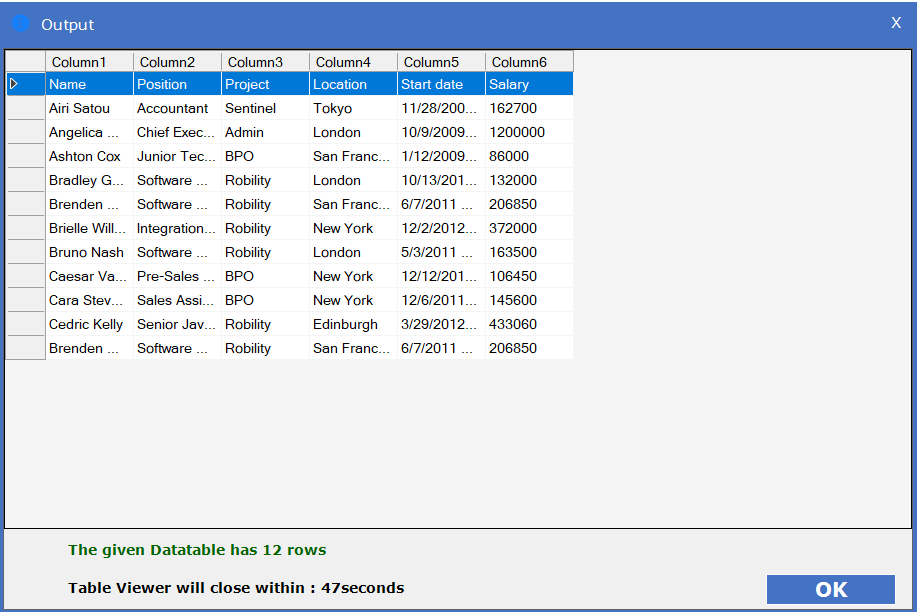
i. Here I am specifying the “Title” as “Output” for the Datatable.
2. Now, I have executed the workflow to view the table.
3. (Below is the sample of the “datatable” that is displayed through
“Table viewer” activity)
Click here to know how the activity is used in the workflow.