Robility dashboards have become dynamic and interactive, you can go beyond the surface and dive into the underlying data. With one-click of a button you can navigate to different layers of the platform to work. It is the very first menu.
Figure 1
SmartManager à Command Centre
The landing page dashboard has been made more responsive with flexible grids and layouts, so viewing from smaller or larger screens will not break the user interface elements.
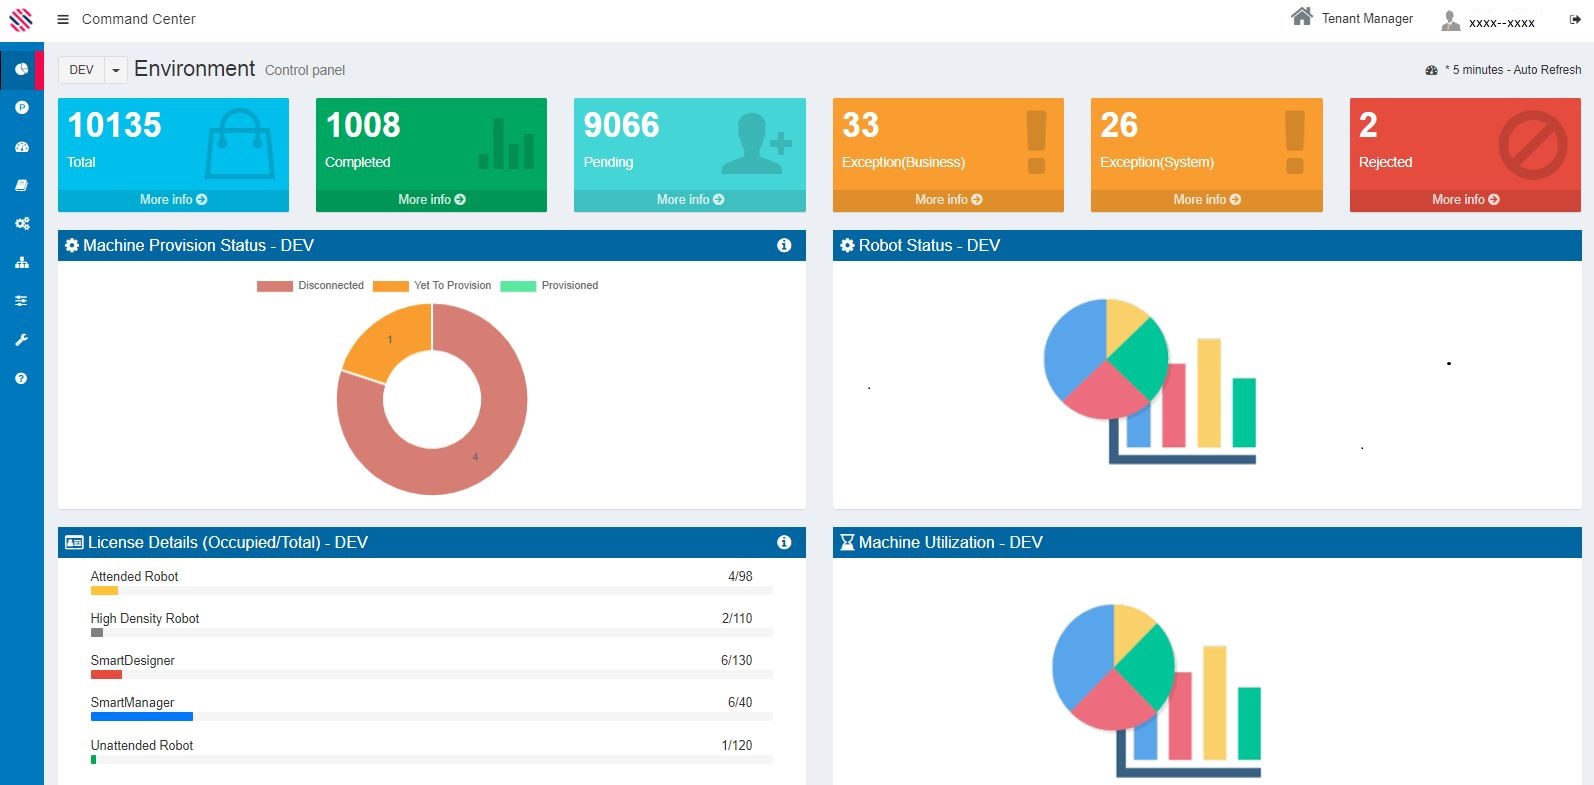
Figure 2
The transaction status tile has undergone three major changes.
Environment filter - This enables users to see the corresponding transaction count in respective environments.
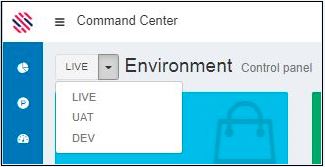
Figure 3
Business and System Exception Queues
We have now upgraded RobilityInteract to provide a granular view of executions by reporting the type of exception a transaction has been tagged to.
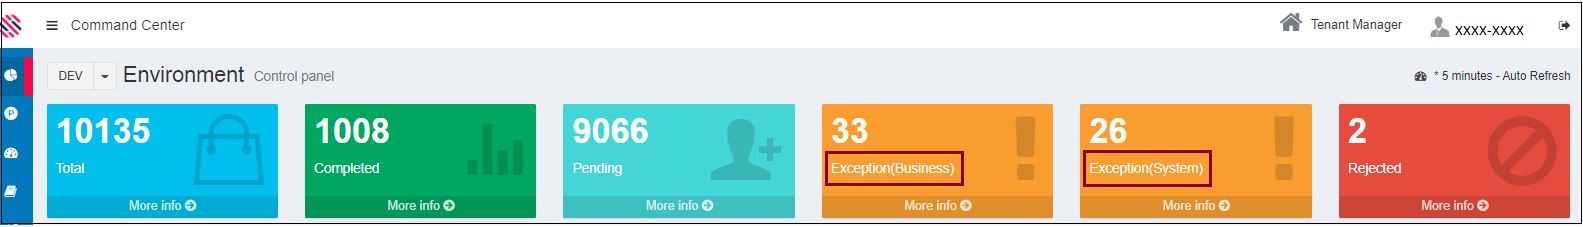
Figure 4
More info link
Clicking on this right arrow will display the corresponding count of transactions by project and you can drill down to the queue wise split-up. You can directly access the corresponding queue by clicking on the queue name. This is a major improvement to user experience as they can completely negate the use of switch environment.
For instance, select the Environment and click on the More Info arrow in the Pending Transactions Text box.
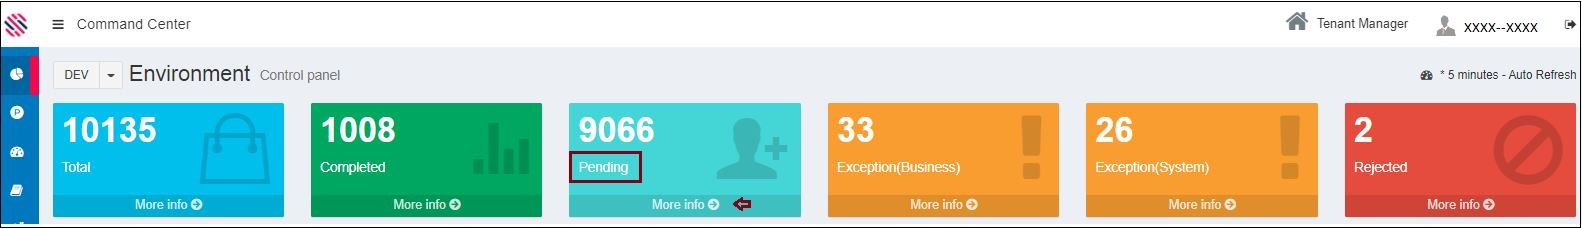
Figure 5
It will display all information pertaining to the selected queue. In the above example, the transactions pending to be processed is selected and corresponding details such as Tenant Name, and Total Transactions that are pending against each Project is provided, so users can prioritize and get started on the Project. To explain in detail, let us consider the Project Robility 7 and click on it.
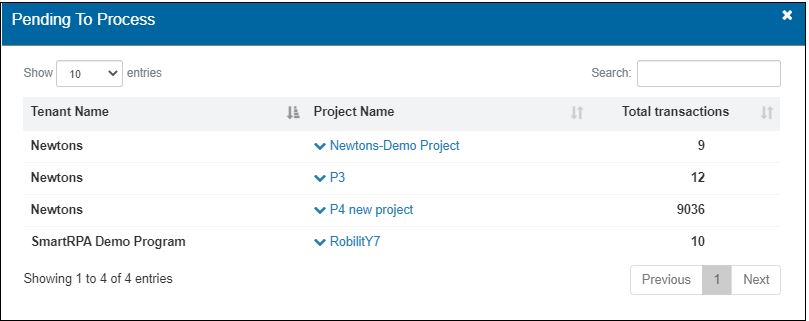
Figure 6
The user will be routed to the My Worklist page without having to navigate to the main menus.
(1)Select the Project as per SLA or other factors and click on it.
(2)Total Pending Transactions for this project are 10.
(3) Four transactions are in the Fetch Data Queue
(6) Six are in the Review Queue.
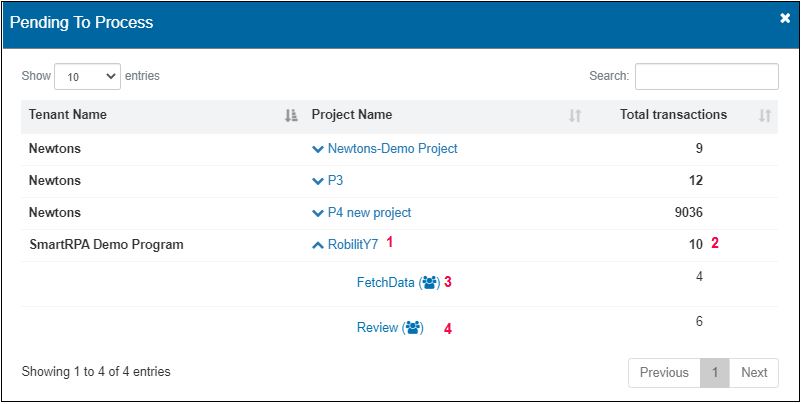
Figure 7
Clicking on the icon will direct the user to My Worklist page without having to navigate to the main menus.
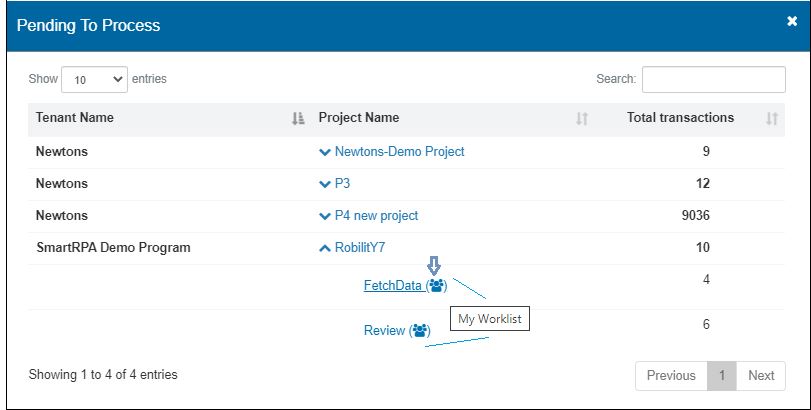
Figure 8
Users can right away click on the URN that requires their immediate attention and can start working. All 10 transaction in the selected project will be displayed The Fetch data queues' transaction will be displayed. Click on the one you want to start at once and proceed. As seen in the aforementioned image, the remaining six transactions in the Review queue will be available for further process.
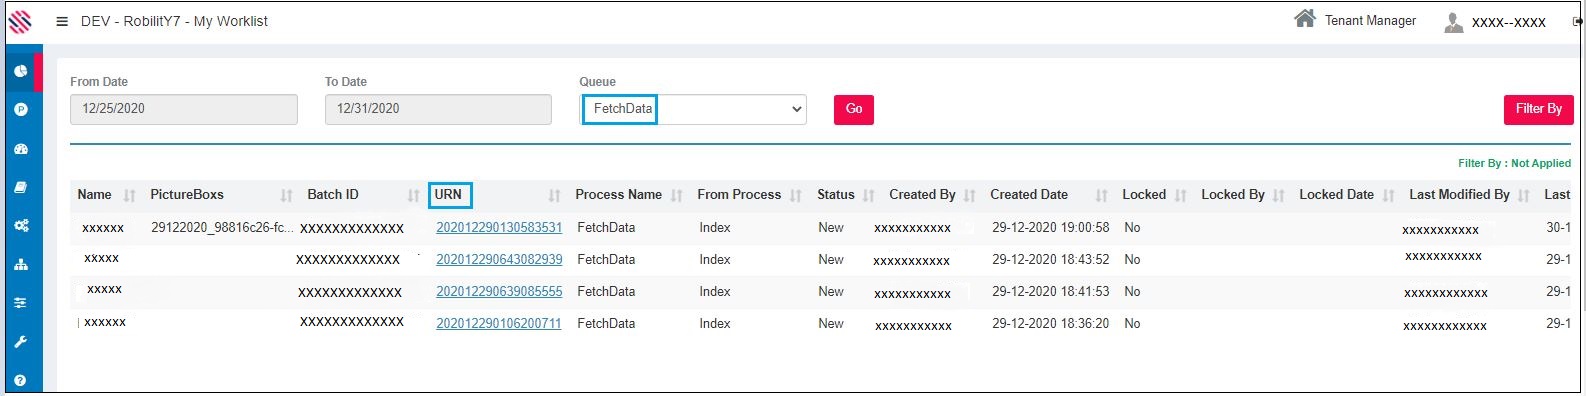
Figure 9
As seen in the following image, Click on the Icon adjacent to Review. User will be directed to My WorkList screen with the remaining six transactions in the Review queue.
Figure 10
User will be directed to My WorkList screen with the remaining six transactions in the Review queue for further processing.
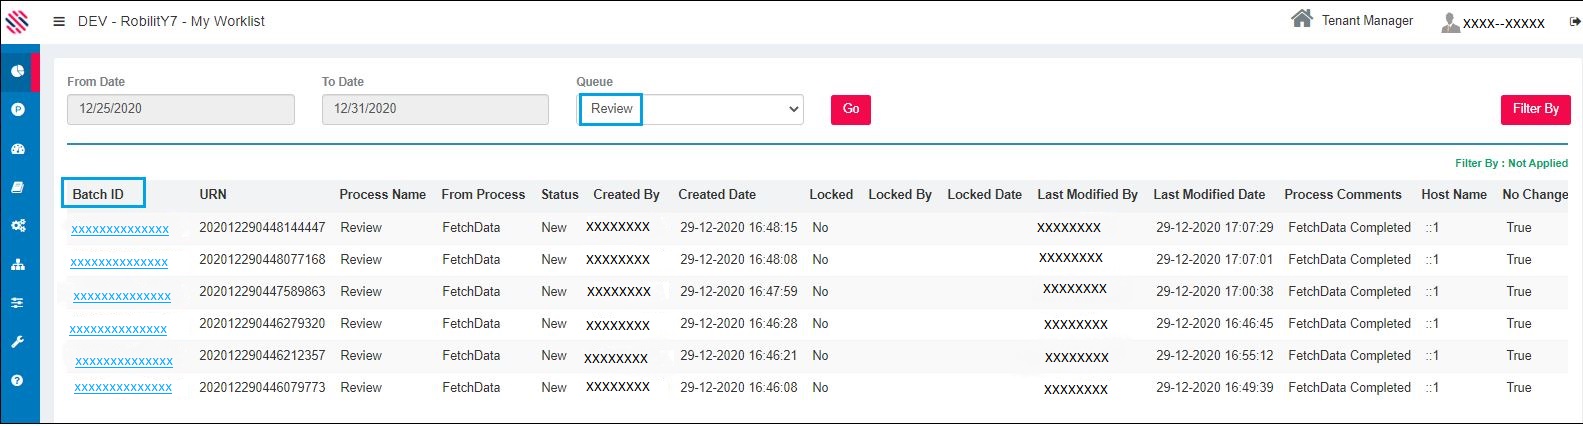
Figure 11
Machine Provision Status and the Robot Status
Machine Provision Status and the Robot Status in all three environments can be viewed as visual representations.
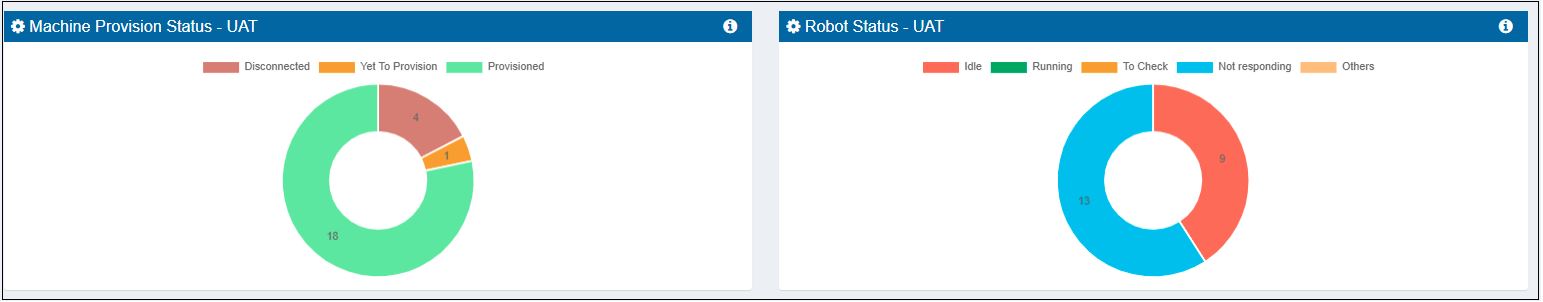
Figure 12
Machine Provision Status
A further drill down of Machine Provision status is possible. Click on the information icon.
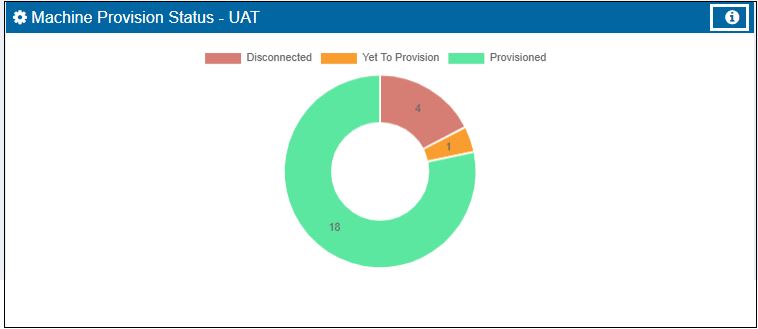
Figure 13
One can view the Machine Name, Tenant Name and Status. Machines in Provisioned, Yet to Provision and Disconnected, which were displayed visually are shown with comprehensive details, as seen in the following image.
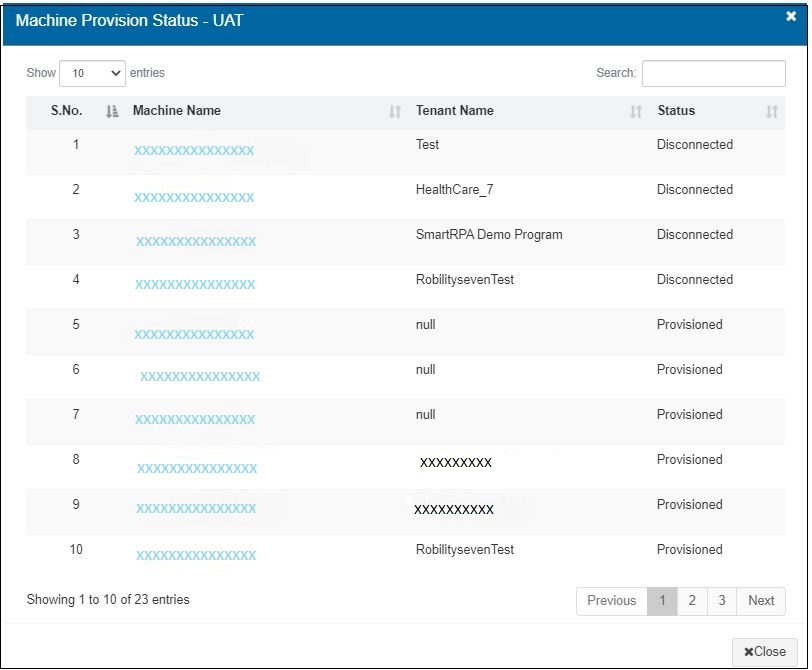
Figure 14
(1) The Search option can be used to filter and view specific (2)Status details. (3) Click on the link under any Machine Name to acquire information pertaining to the selected Machine.
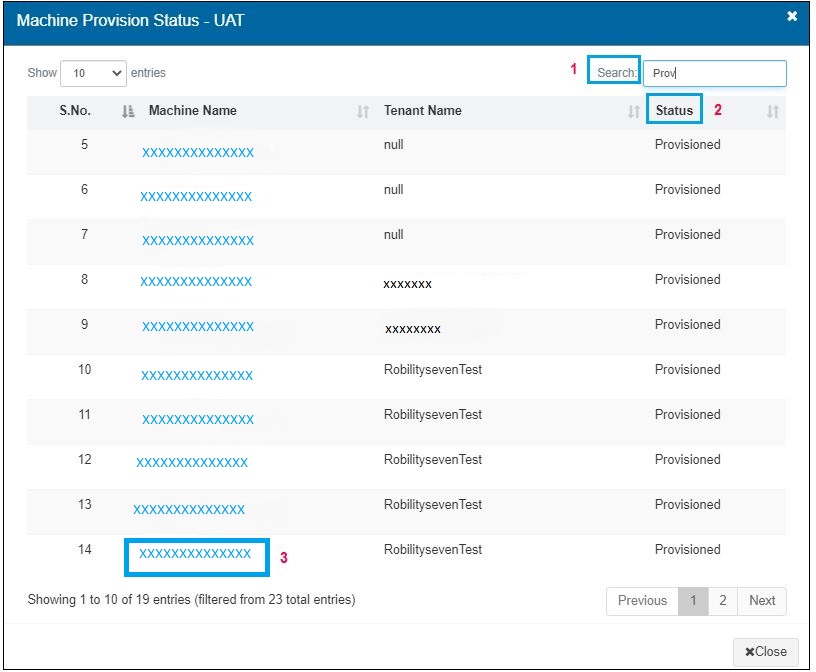
Figure 15
Here, one can also add and map robot's credentials. A detailed explanation follows:
Note: Provision is given only for Live and UAT environments.
(1) Select the Environment.
(2) Select the Credential from the Add Credential text area
(3) Using the double right arrows bring it to the next text area.
(4) Click on the Map button.
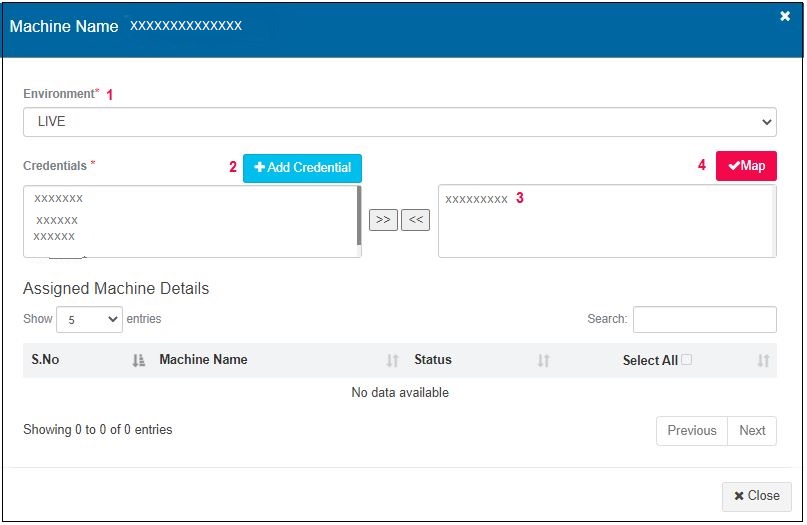
Figure 16
Thus, the robot's credentials has been mapped successfully and the Unassign button will be available.

Figure 17
If required, users can unassign the robot as well. Select the Machine Name and click on the Unassign button.
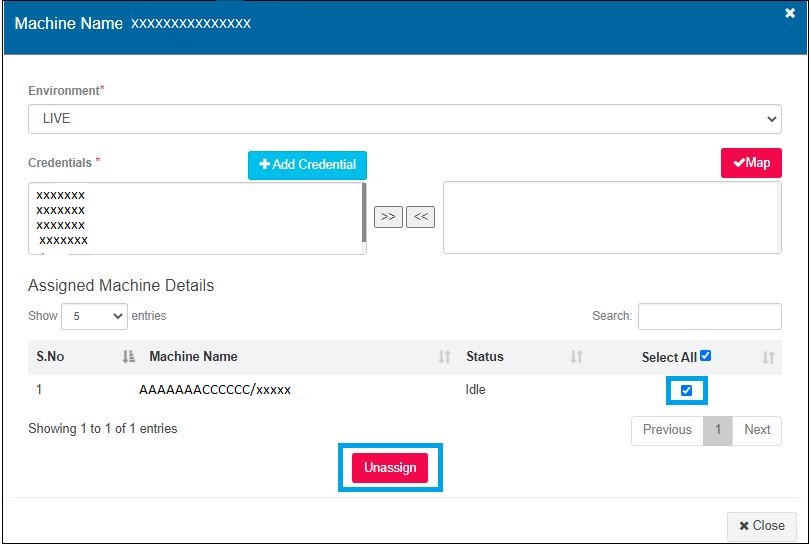
Figure 18
Robot has been unassigned successfully.
Figure 19
Robot Status
Similarly, a drill down to find out about Robot Status is also provided. Click on the Information icon.
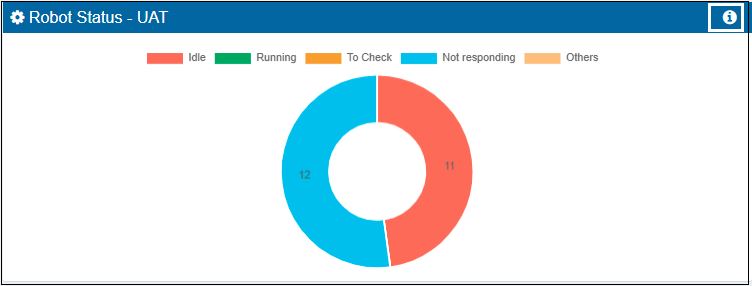
Figure 20
Users will be straightway routed to the Robot Monitoring page without having to go through the main and sub-menus. The Tenant, Project and Robot Name will be listed. Also, comprehensive statuses of the respective robots will be displayed in the UAT and Live environment. This facilitates users to perform all actions that are available in the original menu. Such as monitoring and initiating the running of robots. One can click on an Idle robot and initiate its run as displayed in the ensuing image.
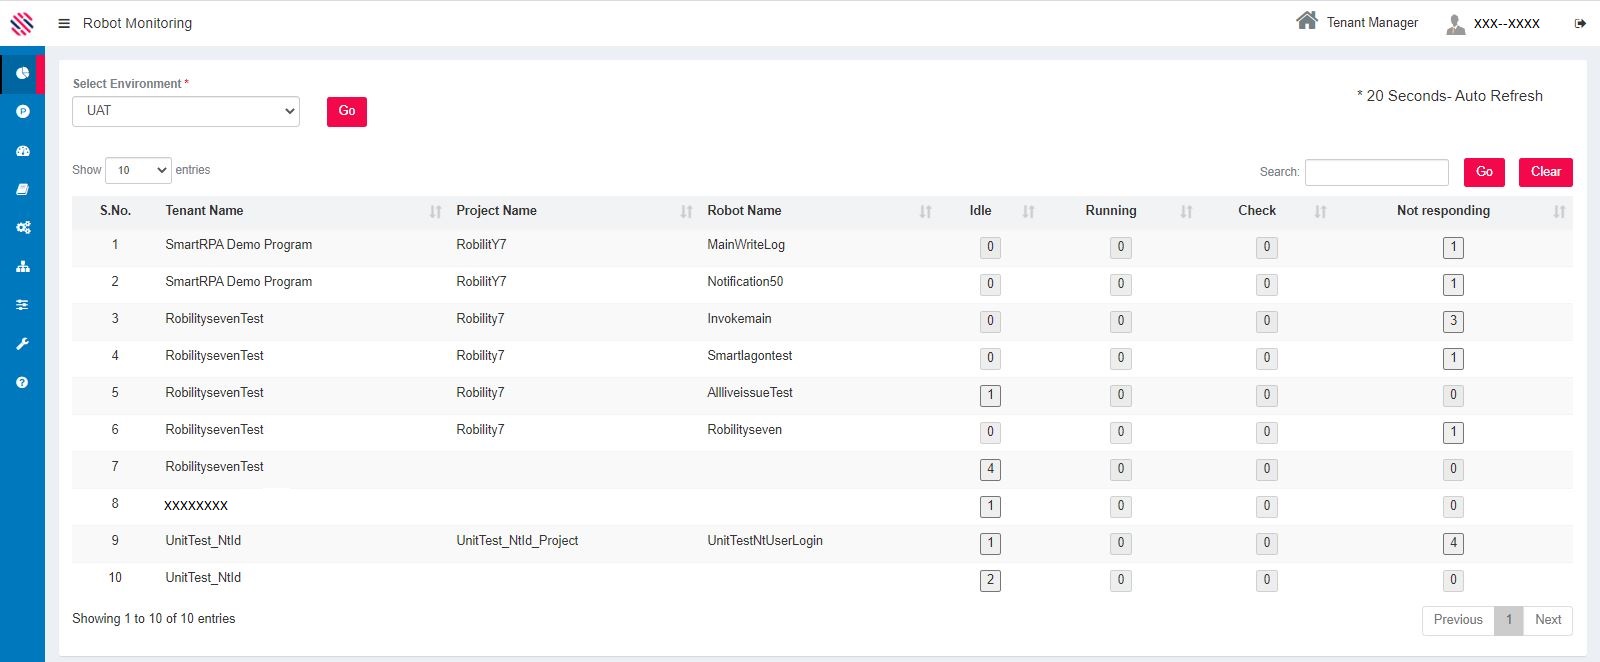
Figure 21
Select the Computer Name. Proceed to select the project and the Robot from the dropdowns at the bottom of the screen. Click on Run.
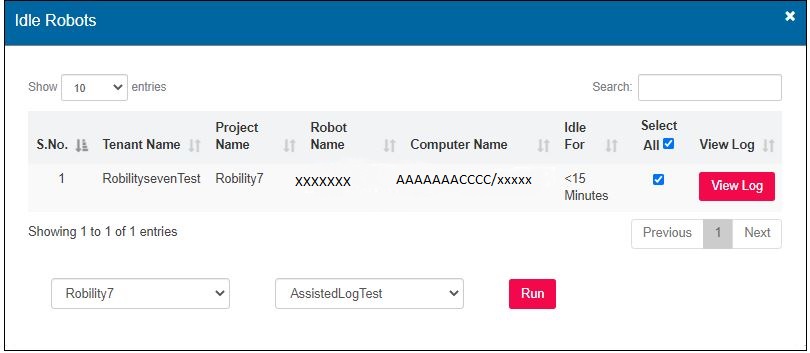
Figure 22
One will get a confirmation message.
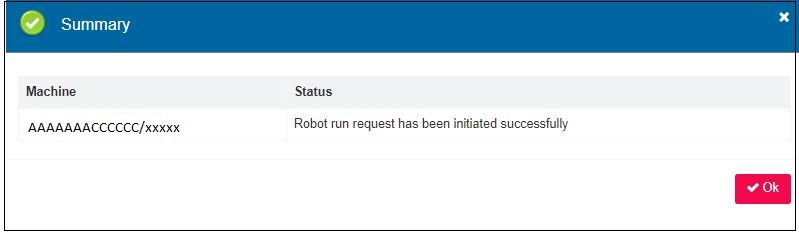
Figure 23
One can view Log details as well by clicking on the View Log Button.
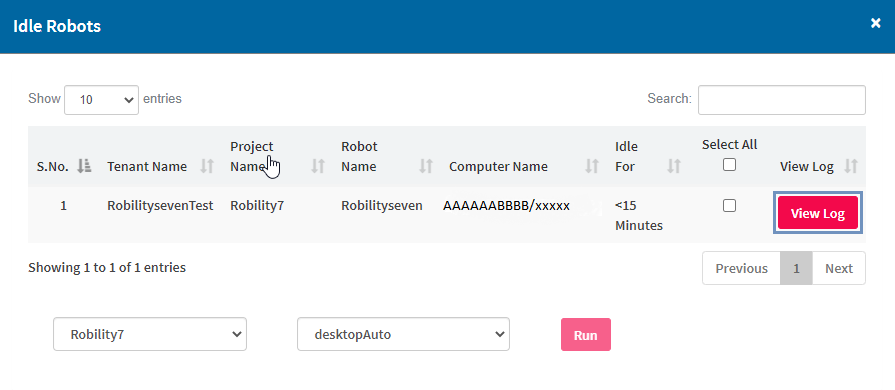
Figure 24
Proceed to view the log details. The same applies for the other environment, namely, Live.
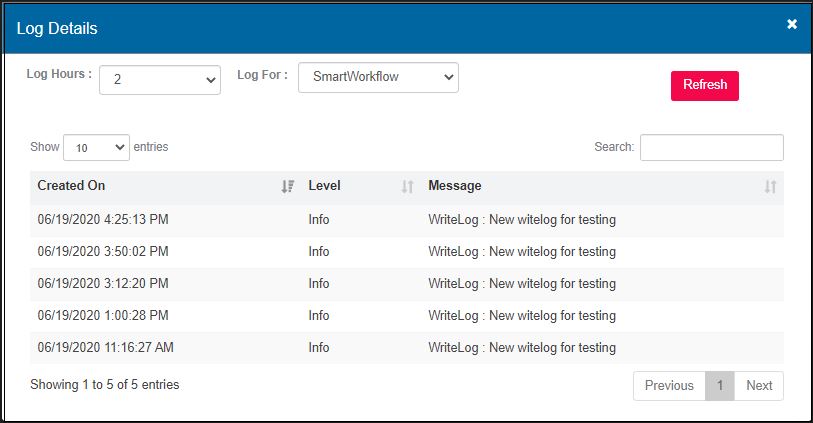
Figure 25
License Details showing the utilized licenses versus available is now part of the landing page dashboard. This provides platform administrators with a bird's eye view to plan resources ahead of depletion.
Machine utilization chart is also included to the landing page dashboard, which was previously accessed via a separate page.
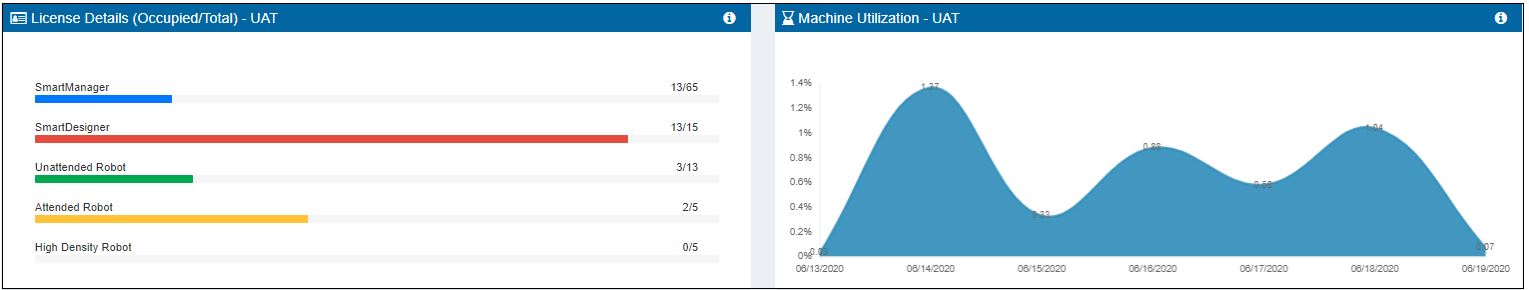
Figure 26
License details
To comprehensively view License details, click on the information icon.
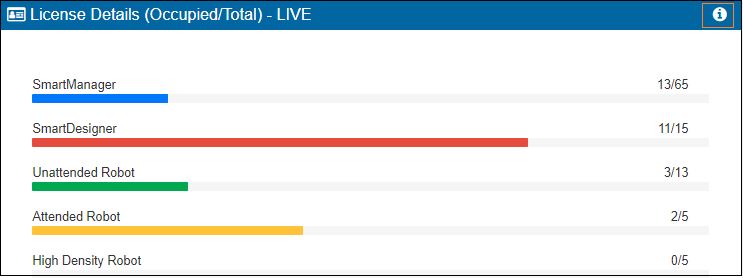
Figure 27
Thus, one can view a comprehensive report of how many different product licenses are Activated, Occupied, Available, Expired and Yet to be activated, thus, amounting to the Total Count.
Note: Once activated, but currently not in use will be tagged as activated licenses. For instance, in the following example, High Density Robot shows a total of 5 and the same number is seen in Activated as well as Available count. This means, the Total Count being 5, all 5 have already been activated, and are available now, ready to be allotted.
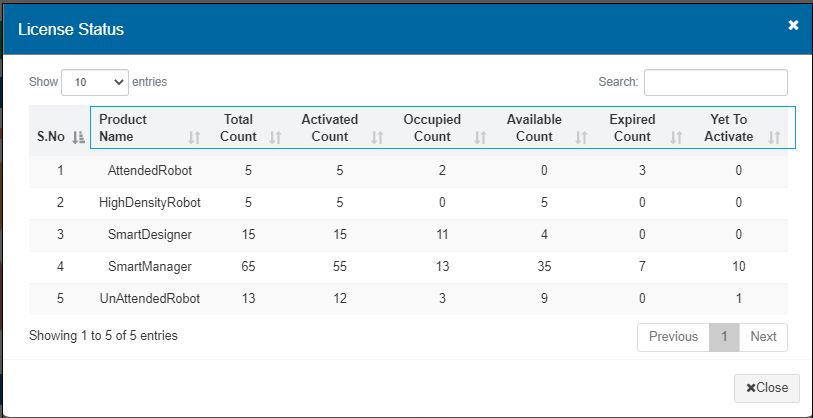
Figure 28
Machine Utilization
Similar drill down for Machine Utilization is also possible. Click on the information icon. Users will be routed to the Machine Utilization page, as displayed in the ensuing image.
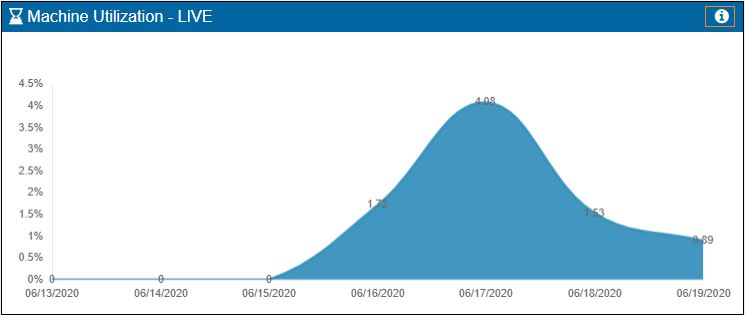
Figure 29
By default, one week's data will be auto selected and displayed. One can select the environment (all three are enabled), the Start and End Date and click on the Go button to view details as per the specified date range and the selected environment.
The Tenant and Project Name, Robot Count, Total Duration in hours and minutes, Utilized Hours, also in hours and minutes, and the Utilized Percentage will be displayed. View option will further enable a window comprising machine details of the selected Tenant, as displayed in the ensuing image.
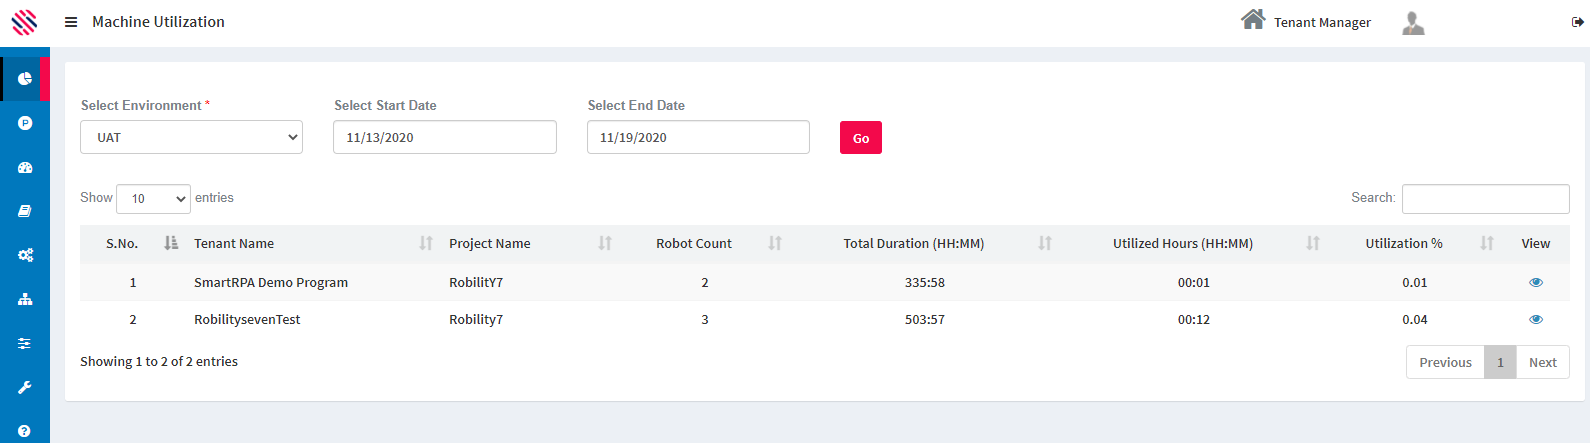
Figure 30
Upon clicking on the Eye icon, under View header the Tenant's Machine Details will be displayed as displayed in the ensuing image.
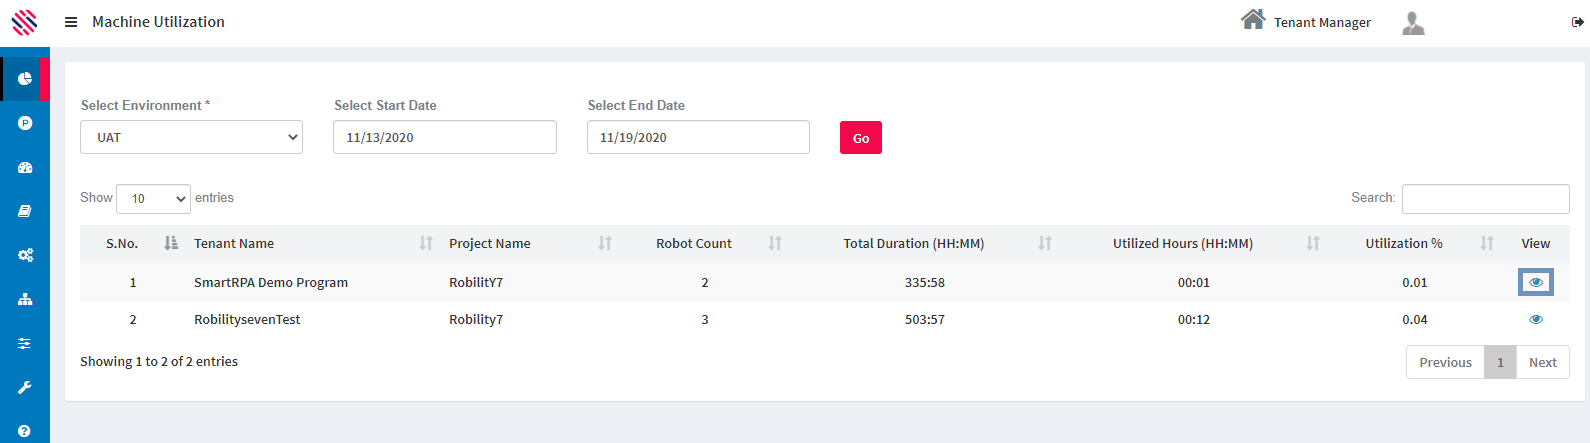
Figure 31
One can view the Machine Name, Total Duration (in hours and minutes), Utilization (in hours and minutes) as well as the Utilization Percentage.
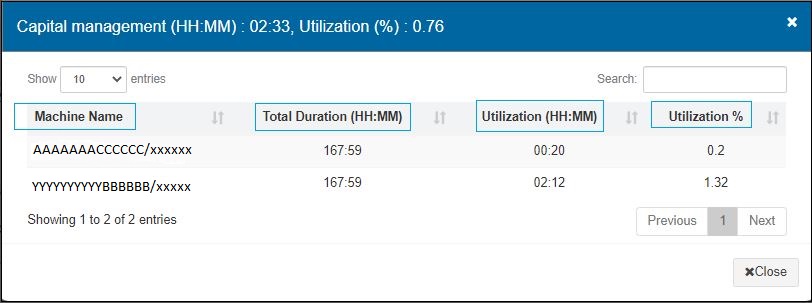
Figure 32
Important Information
Please be informed about the method used in calculating the Machine Utilization percentage.
Formula Followed To Calculate The Machine Utilization Percentage
(Utilized minutes/Total duration in minutes per day) * 100
Example For Single Machine:
Machine ran for 10 minutes in a single day. Single day is considered as 24 hrs. and 24 hrs. conversion is to be done, to derive the total duration in minutes per day, therefore 24 * 60 = 1440 minutes.
Thus, the Utilized Minutes = 10
Total duration in minutes per day = 1440
Now apply the formula.
(Utilized minutes/Total duration in minutes per day) * 100
(10/1440) *100 - Utilization percentage = 0.69% or rounded off to 0.7%
Example For Two Machines:
Machine A ran for 23 hours in a single day
Machine B ran for 20 minutes in a single day
Total utilized minutes for 2 machines = 23* 60 = 1380(Machine A) + 20 (Machine B) = 1400 Minutes
Total duration in minutes per day for 2 machines = 2*24*60 = 2880
(1400/2880) *100 = 48.61%
Note
- Hours to be converted to minutes before applying the formula
- To derive the utilization percentage, multiply the value by 100. Therefore, if it is 0.52, Machine utilization percentage will be - 0.52 *100 = 52%.