Vision monitoring:
- Monitor and corrects the user’s activities.
- To see anomalies, types of anomalies, and to reduce them
- To ensure business runs in a safe and secure environment.
Important: The user list with supervisor mapping, shift duration and week offs have to be correctly updated for vision report to work. Please refer masterdata configuration link for help.
A brief on elements of the report:
Consolidated summary of anomalies reported for a specific duration of an entire team.
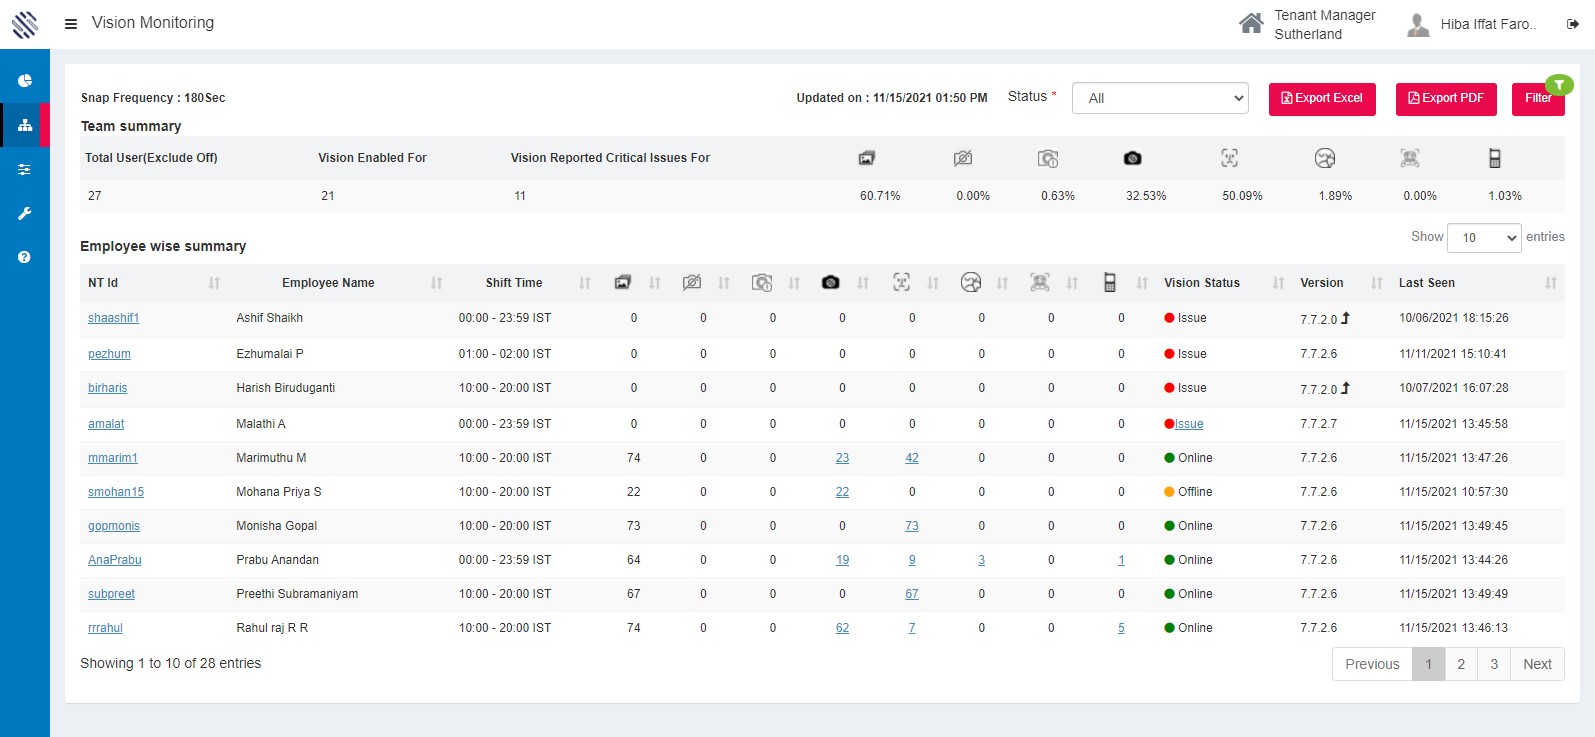
Figure 1
On the following, you can find how the vision report works and what are the elements of it.
- The vision report takes snaps of every registered user of sentinel for every 180 secs.
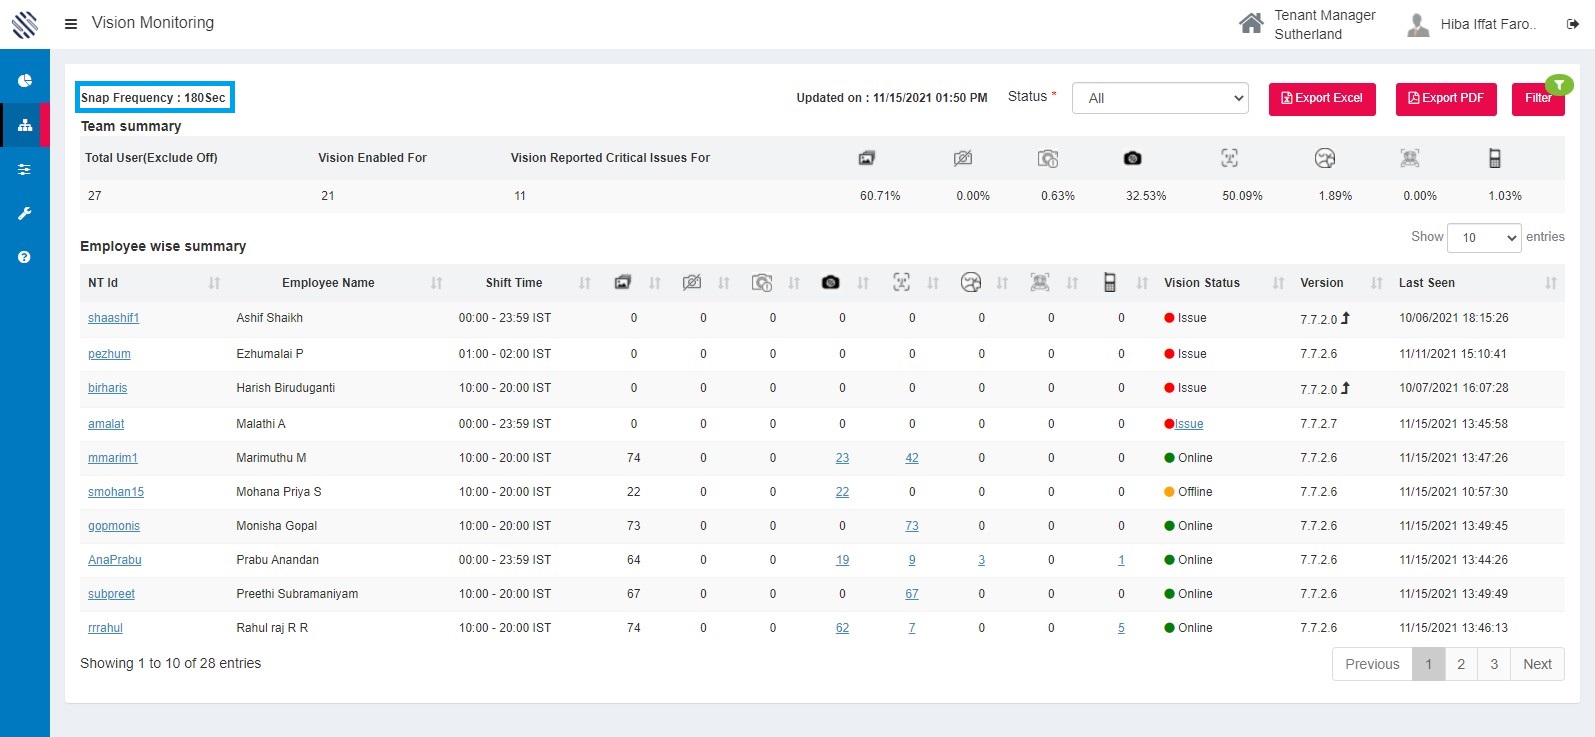
Figure 2
- The vision report refreshes for every 10 minutes.
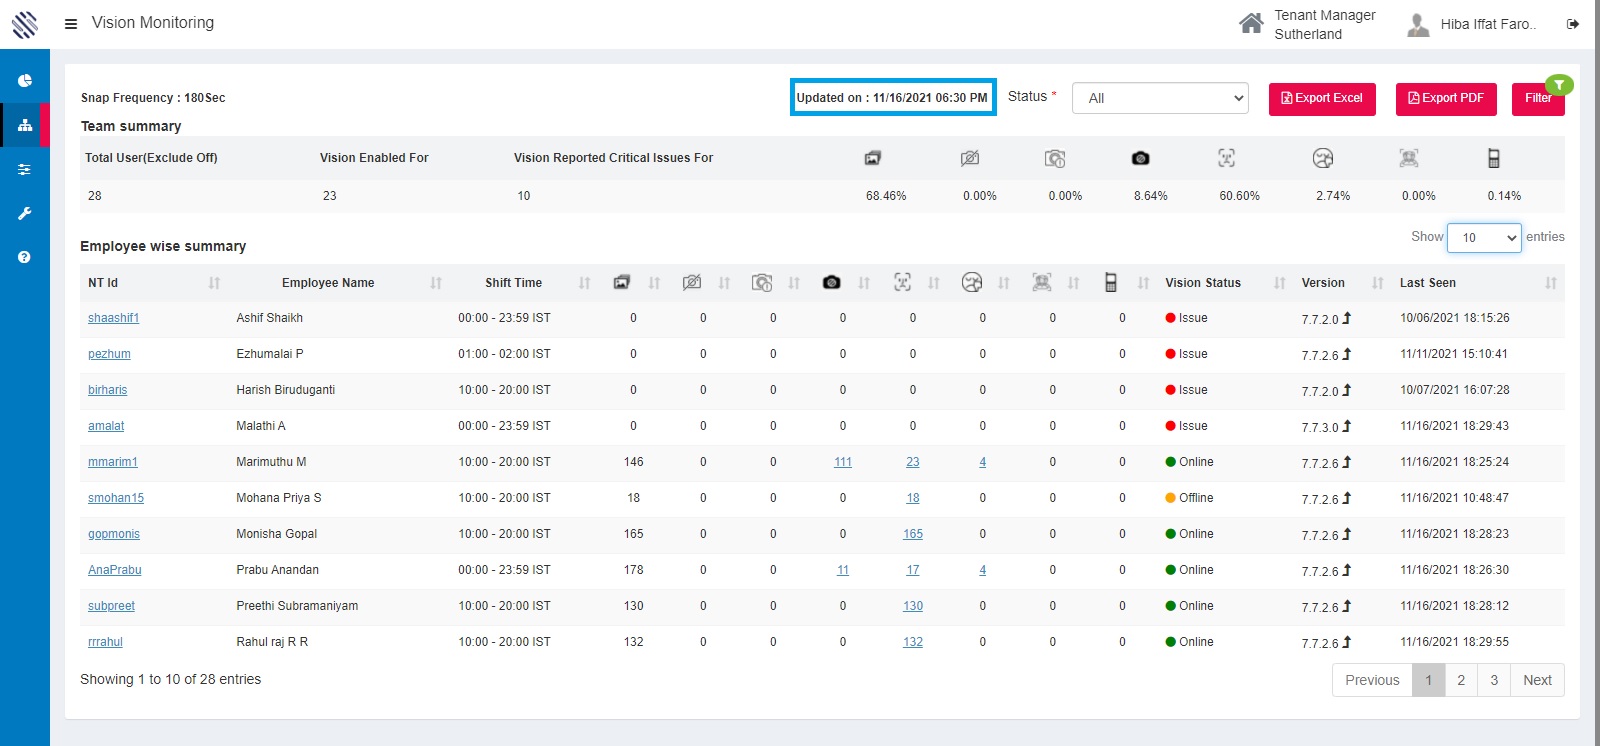
Figure 3
Vision report status explained:
The status drop down from the above picture depicts the status of every registered user on this platform. It shows whether they are online or offline or having issues or not even registered.
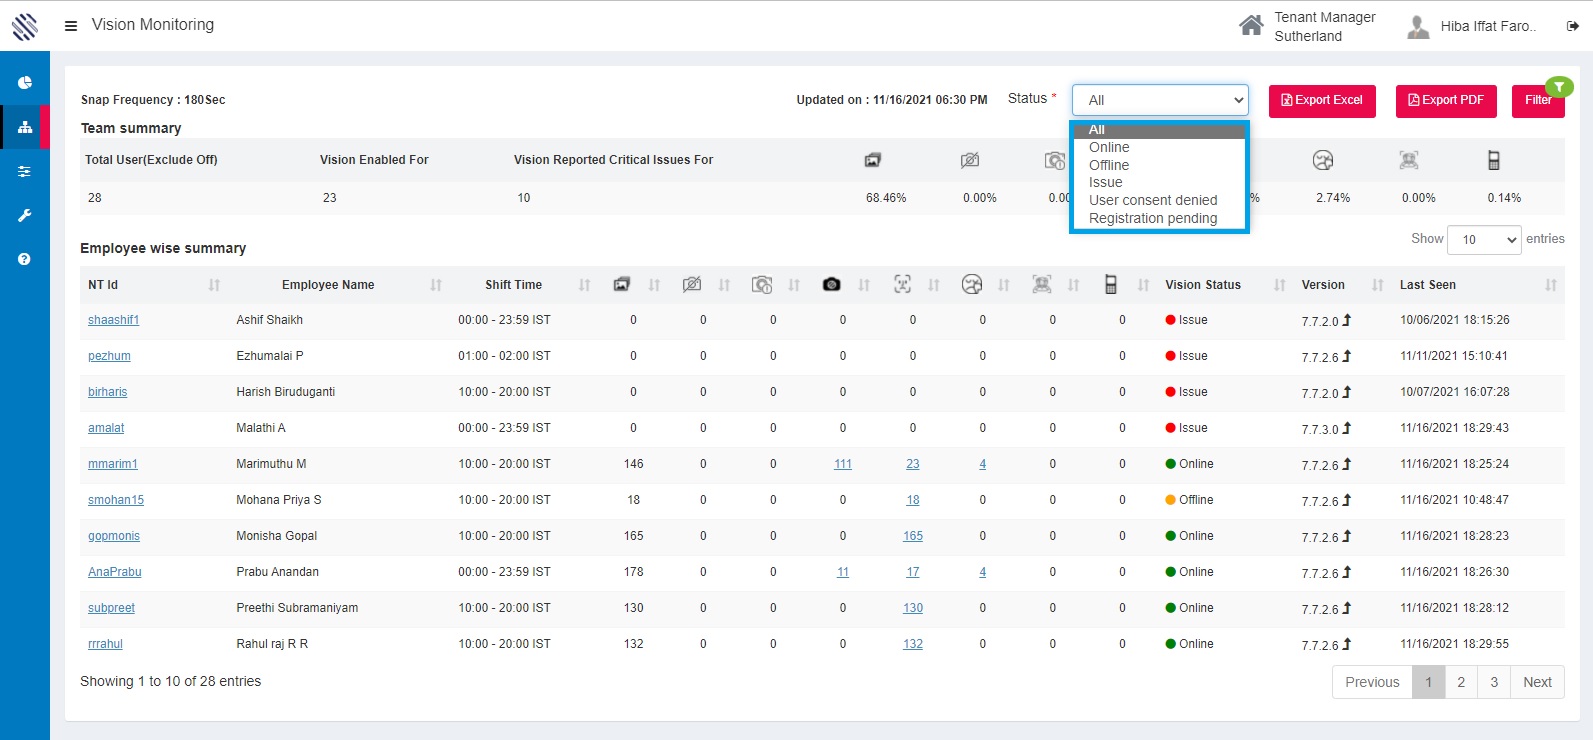
Figure 4
Online: This status indicates that the users have successfully registered to use Sentinel.AI, and the images are coming into the platform as expected.
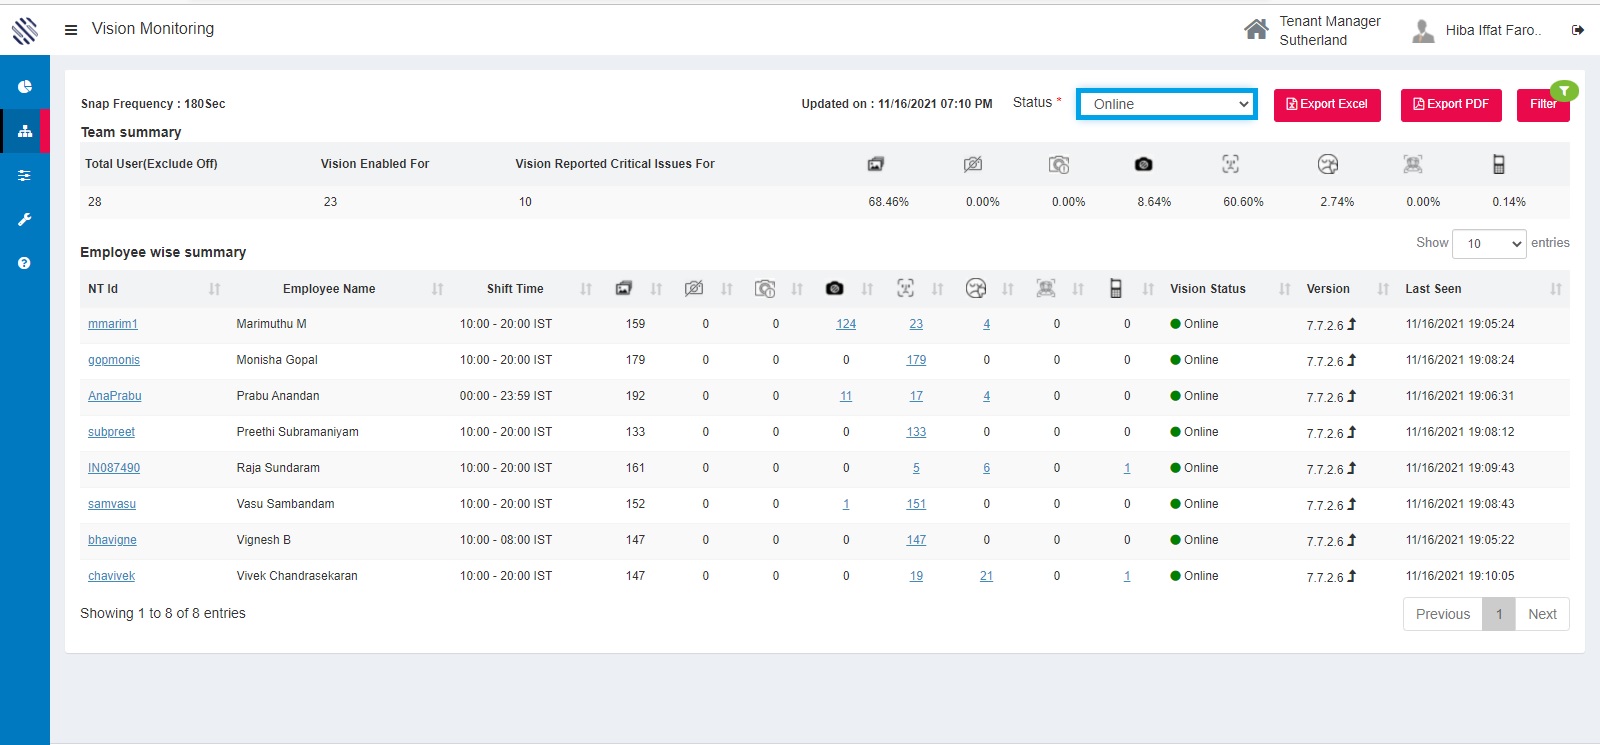
Figure 5
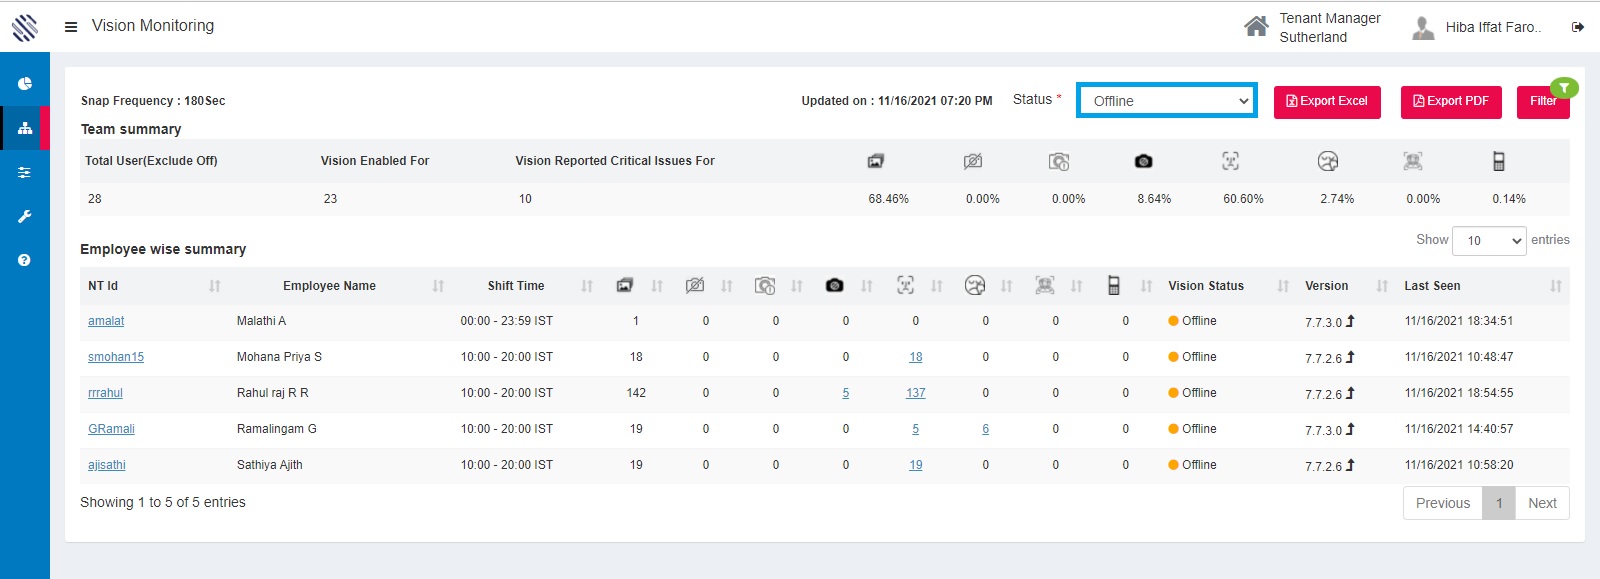
Offline: Users have successfully completed registration but fewer images or no images have been received by the Sentinel. AI platform for the past 10 minutes. Once the images are received the status will change to online.
 \
\
Figure 6
Issue: This could be caused due to unplanned leave. No images have come into the platform during their scheduled shift duration.
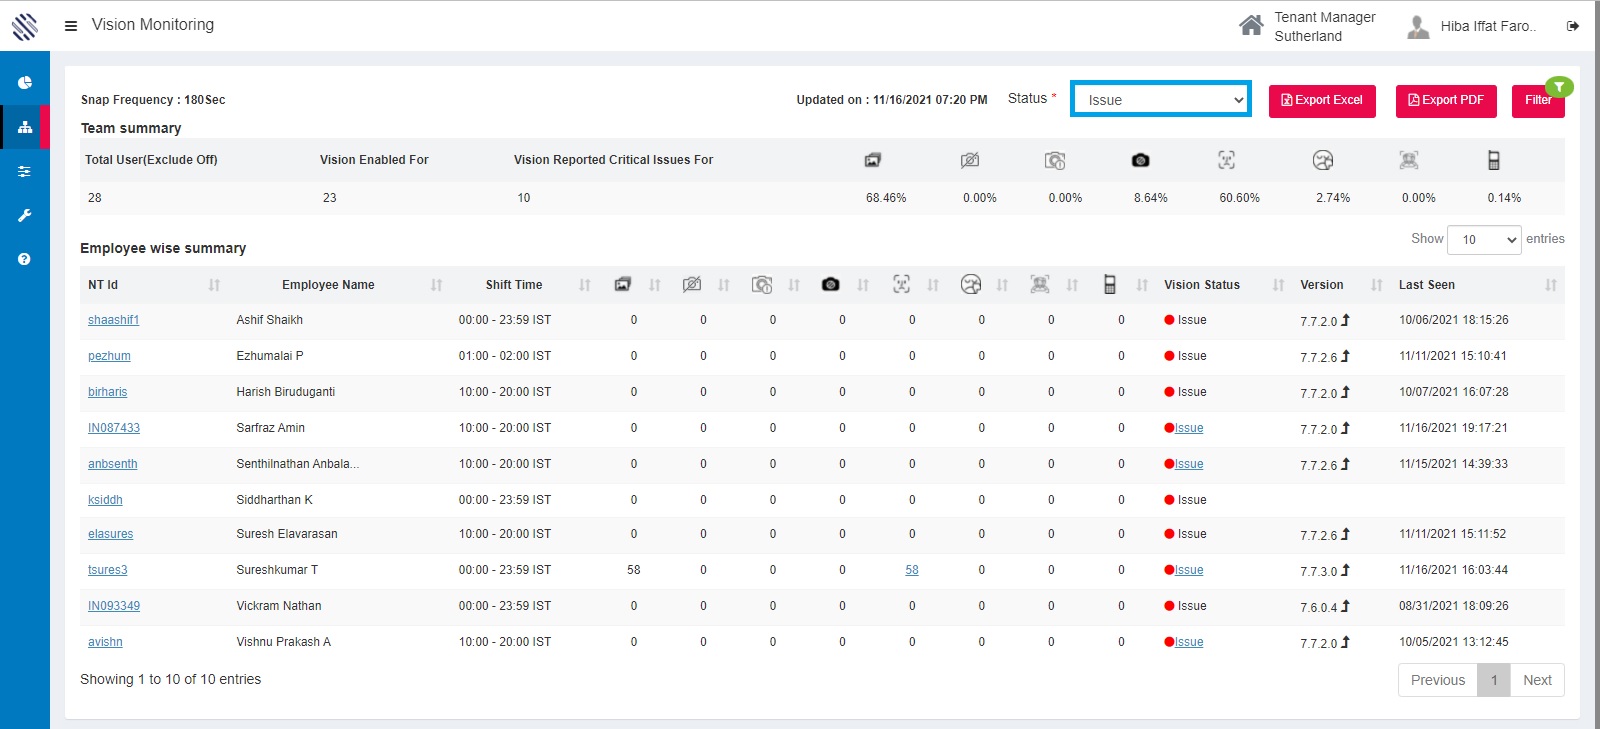
Figure 7
Registration pending: This status is shown for users who have not agreed to the consent and taken manual snap.
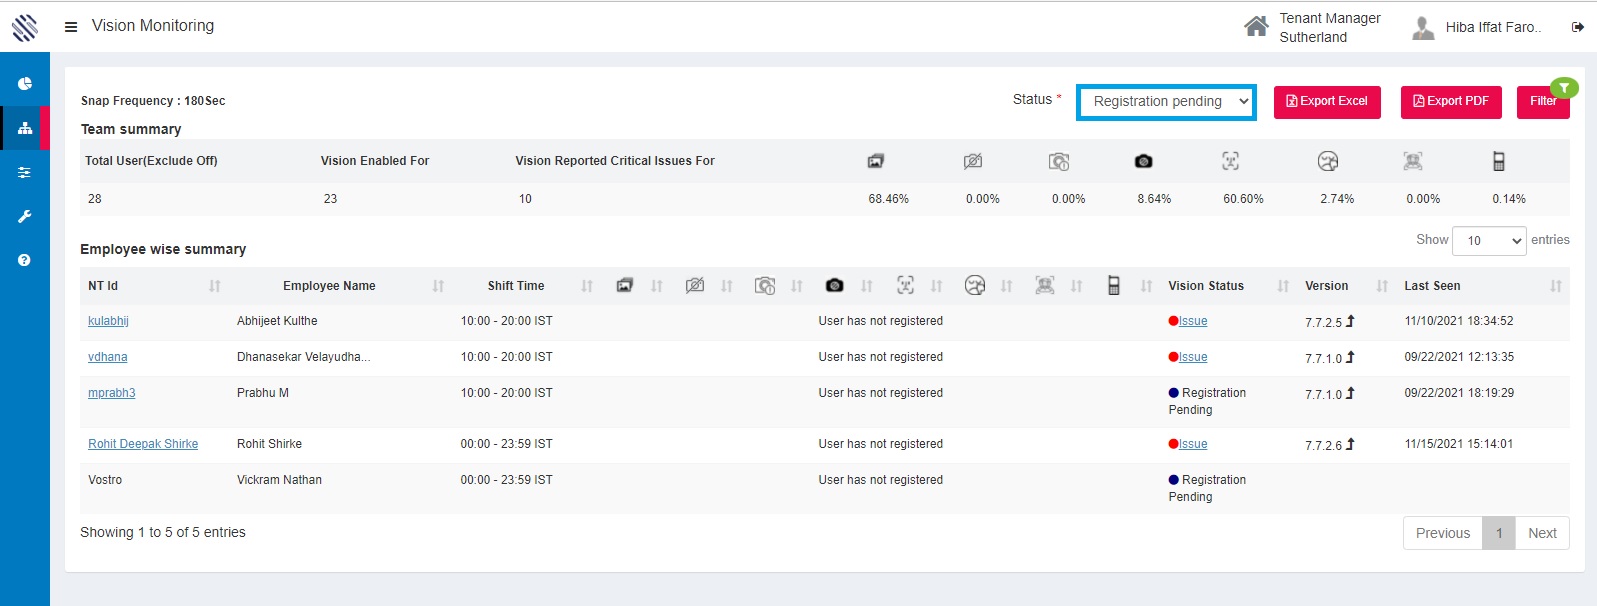
Figure 8
Consent denied: This status is shown for users who have declined to the Sentinel. Ai consent form.
Exporting the report:
You can also export the vision report either in excel sheet or pdf format.
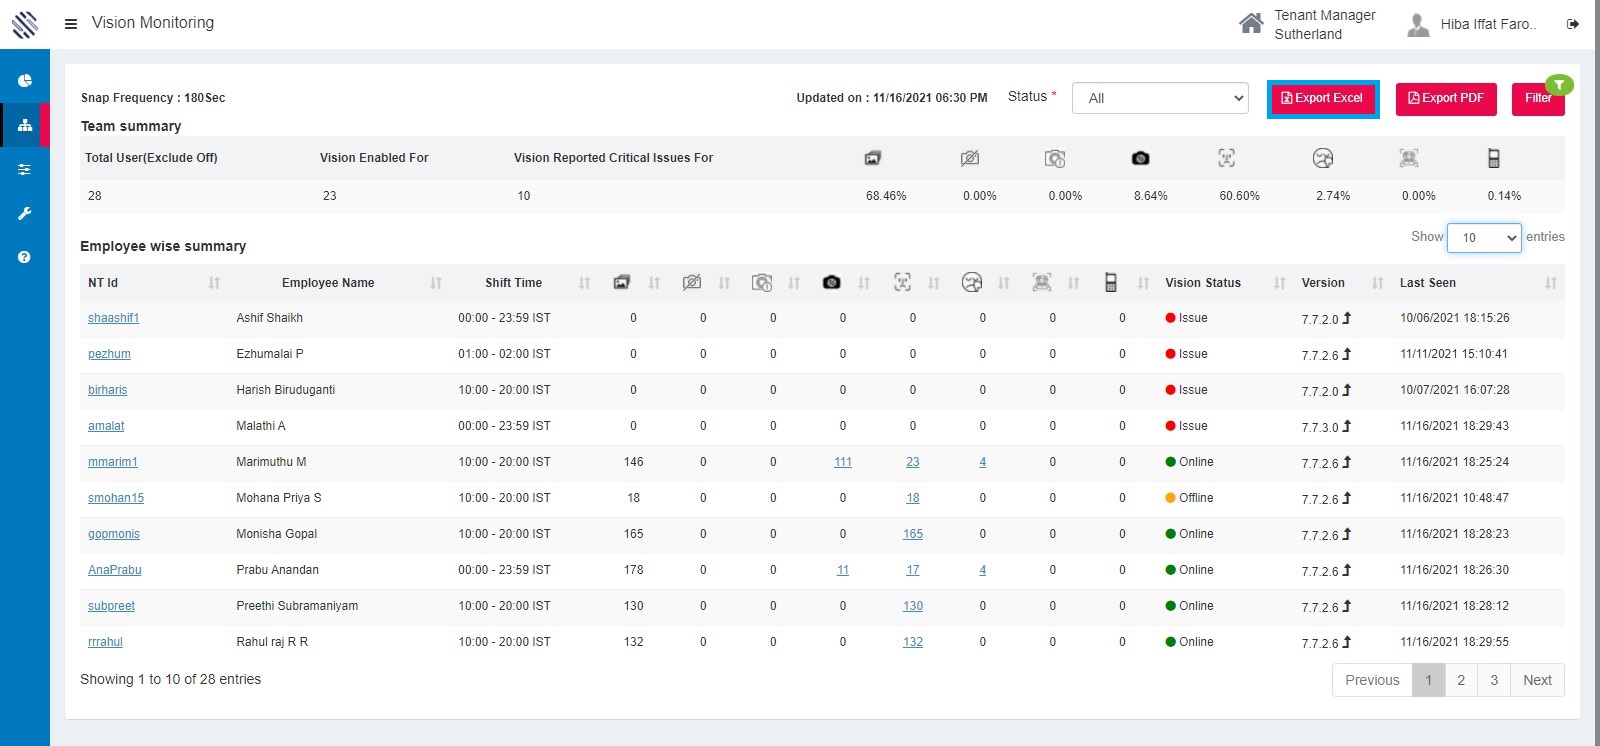
figure 9
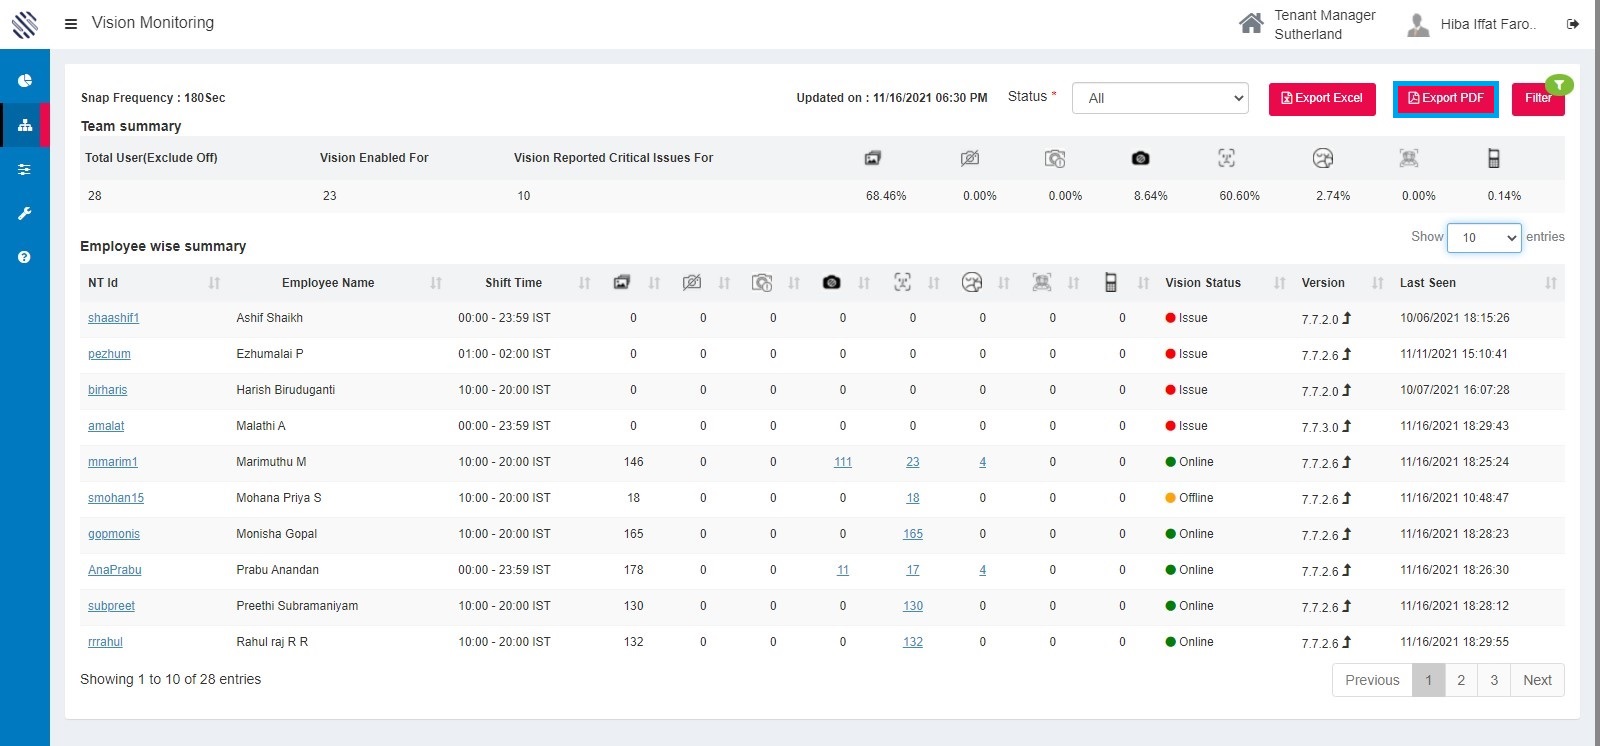
Figure 10
Filtering the report:
Here you can filter the data as shown below.
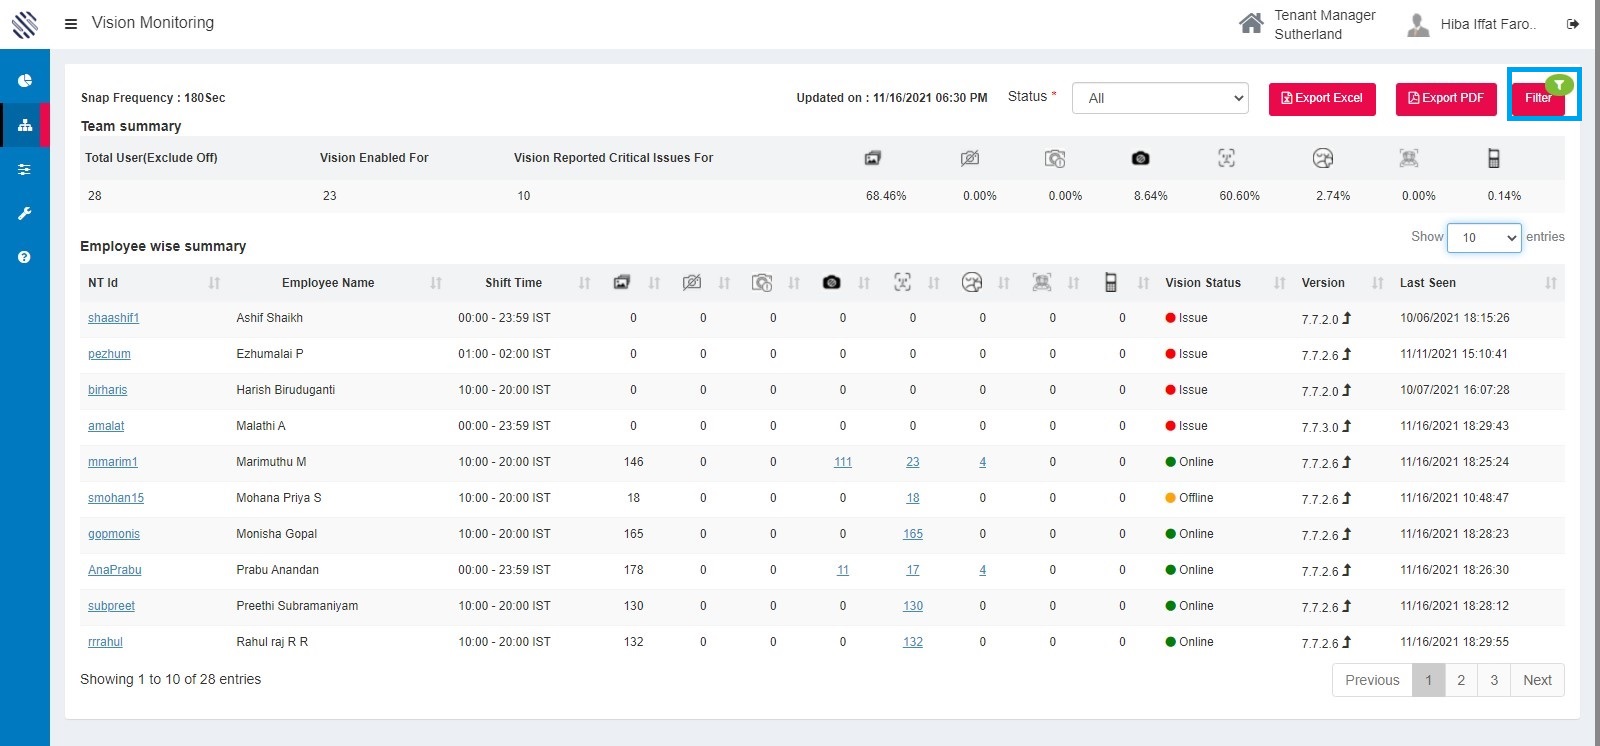
Figure 11
Click on the filter button , a pop – up appears as shown below.
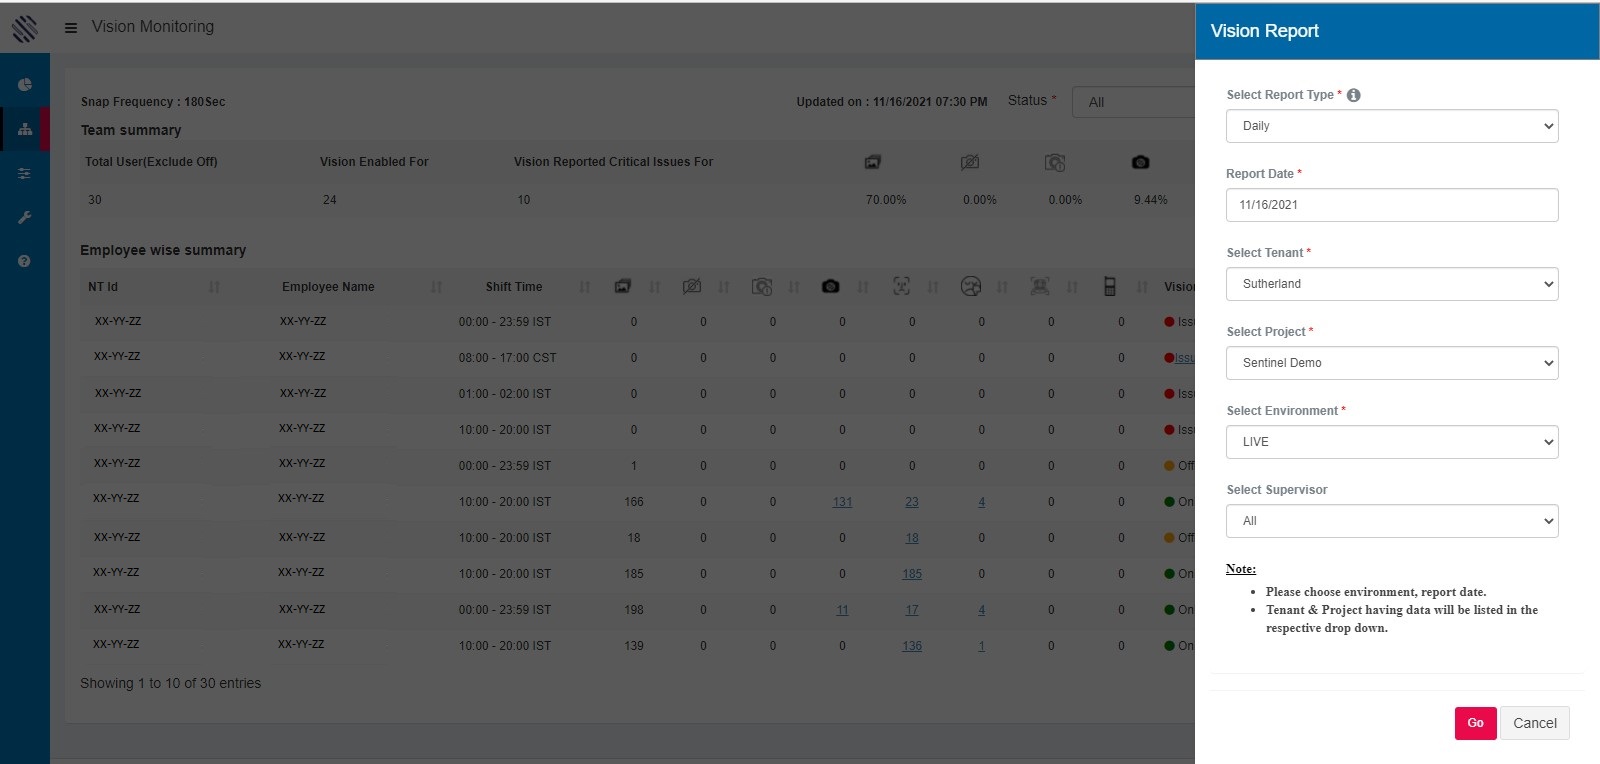
Figure 12
Click on the “i” button to know a brief details about the elements of the report.
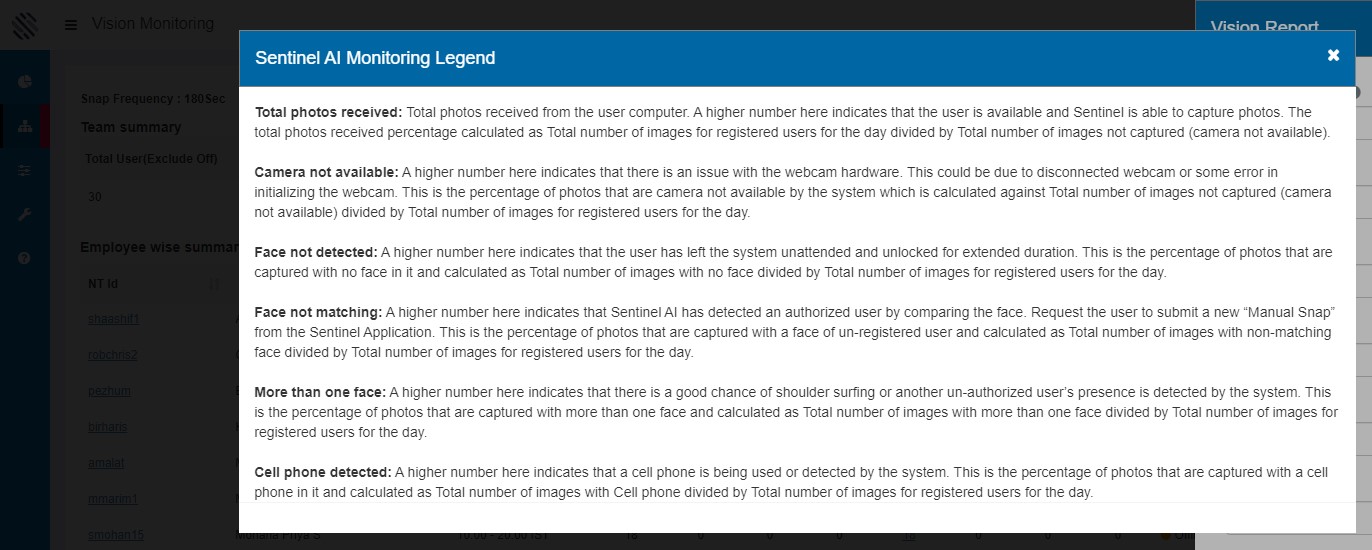
Figure 13
Next, from the “select report type” drop down, you can either select daily or custom (90 days) based on the request made as shown below.
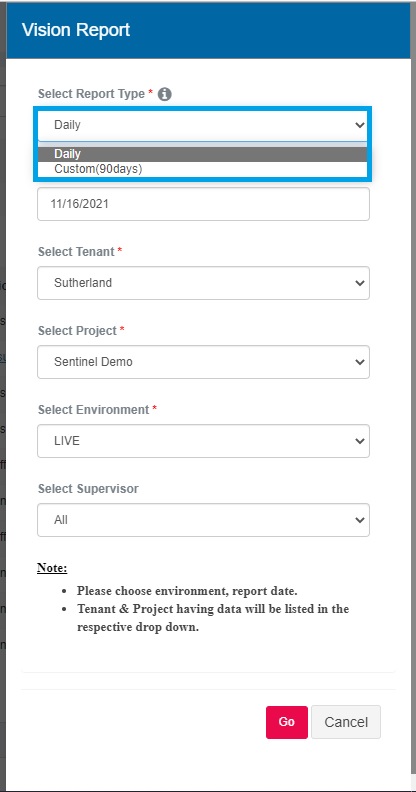
Figure 14
The user can select another option,” report date” here the user can inspect the anomalies in respective date.
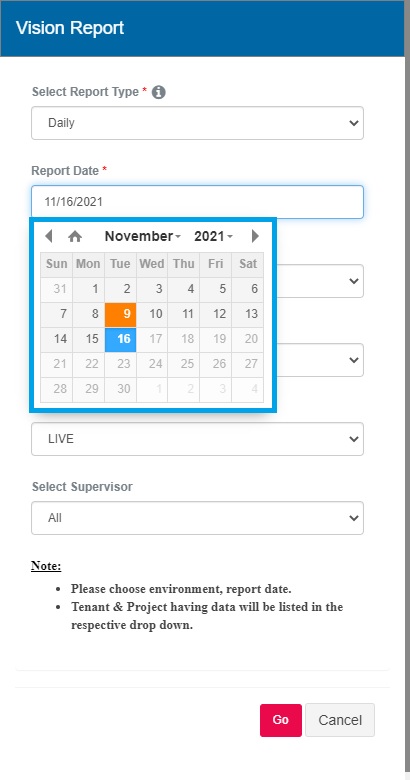
Figure 15
“ Select tenant” drop down, the user can select the respective tenant as per the request. They don’t have to go to the home page often.
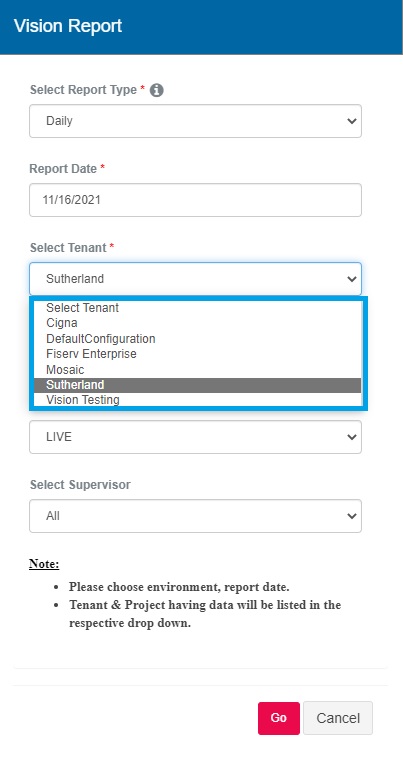
Figure 16
“Select project” , from this drop down the user can select the respective project as per the request.
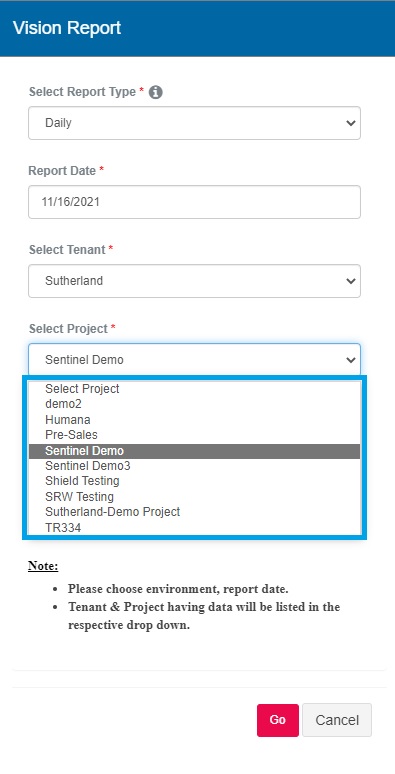
Figure 17
“Select environment”, from this drop down the user can select the respective environment as per the request.
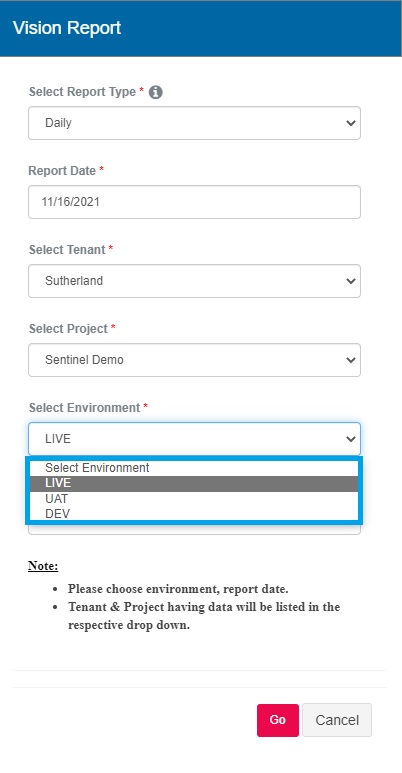
Figure 18
“Select supervisor ” drop down helps the user to select the respective supervisor from the list and according to it filters the grid based on the reportee.
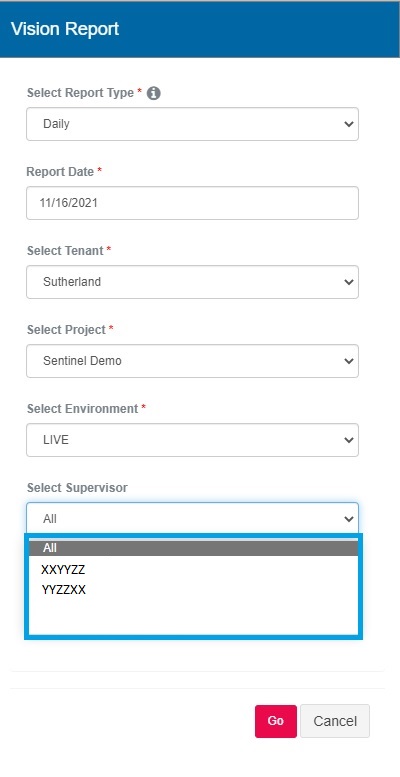
Figure 19
After filtering, select the GO button.
Team Summary: Team wise summary for users who are on shift and registered under Sentinel AI platform.
Total user (excluded off): This includes number of invited users and registered users on the Sentinel AI platform.
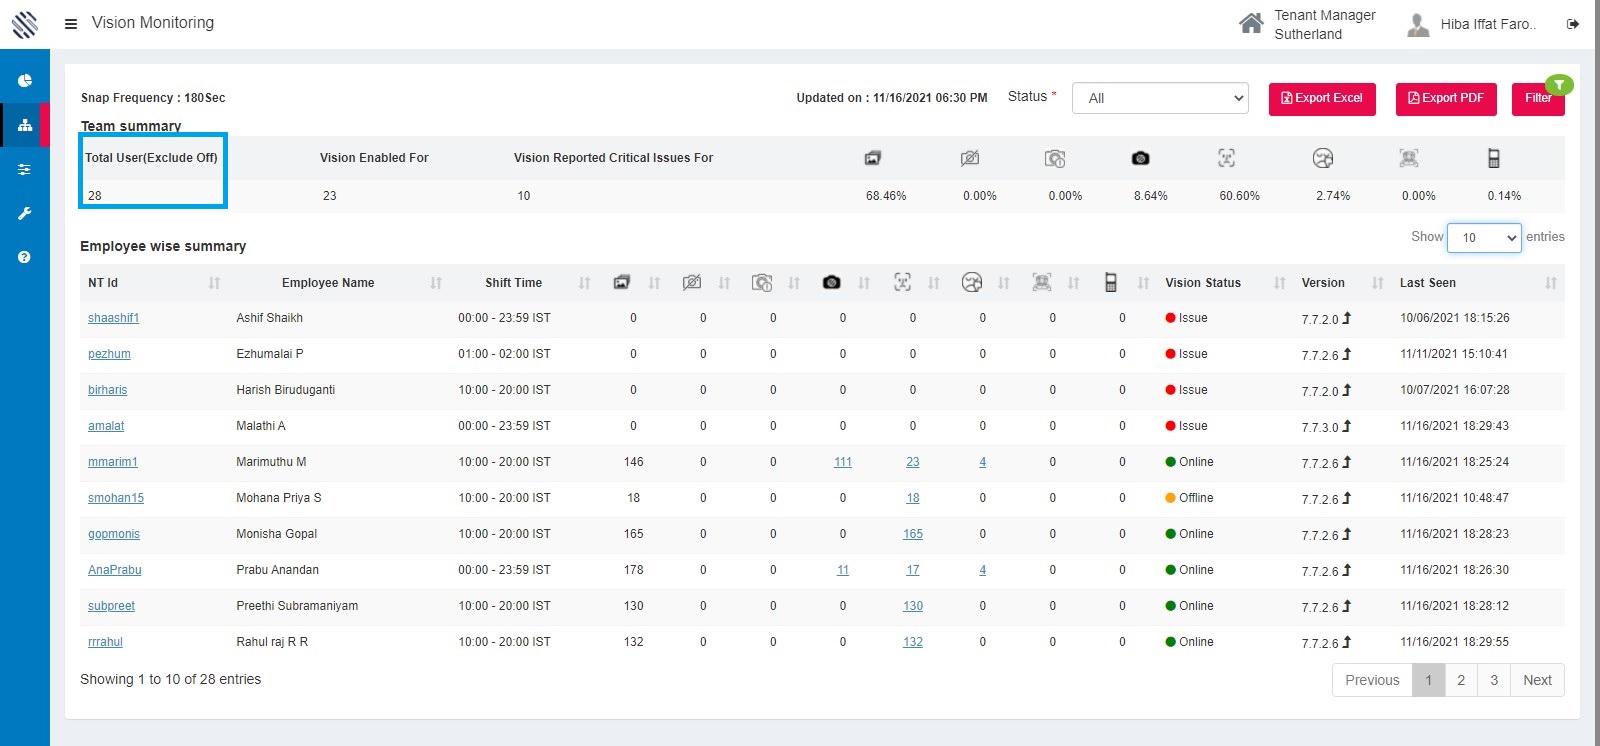
Figure 20
Vision Enabled For: It displays the total number of the users who have agreed to the consent and taken manual snap.
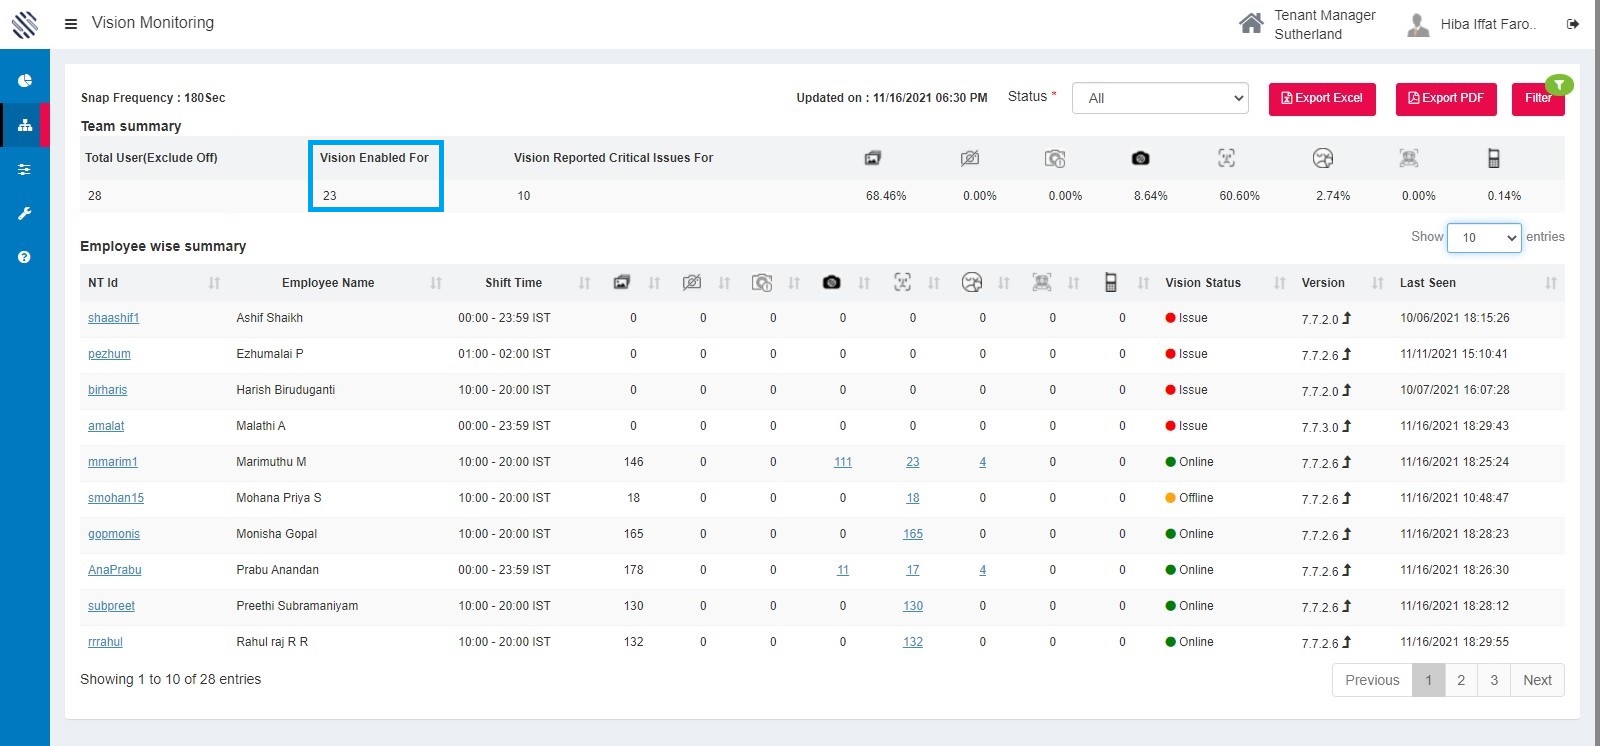
Figure 21
Vision Reported Critical Issues For: It displays the total number of the users for whom no photos has been received on the their shift.
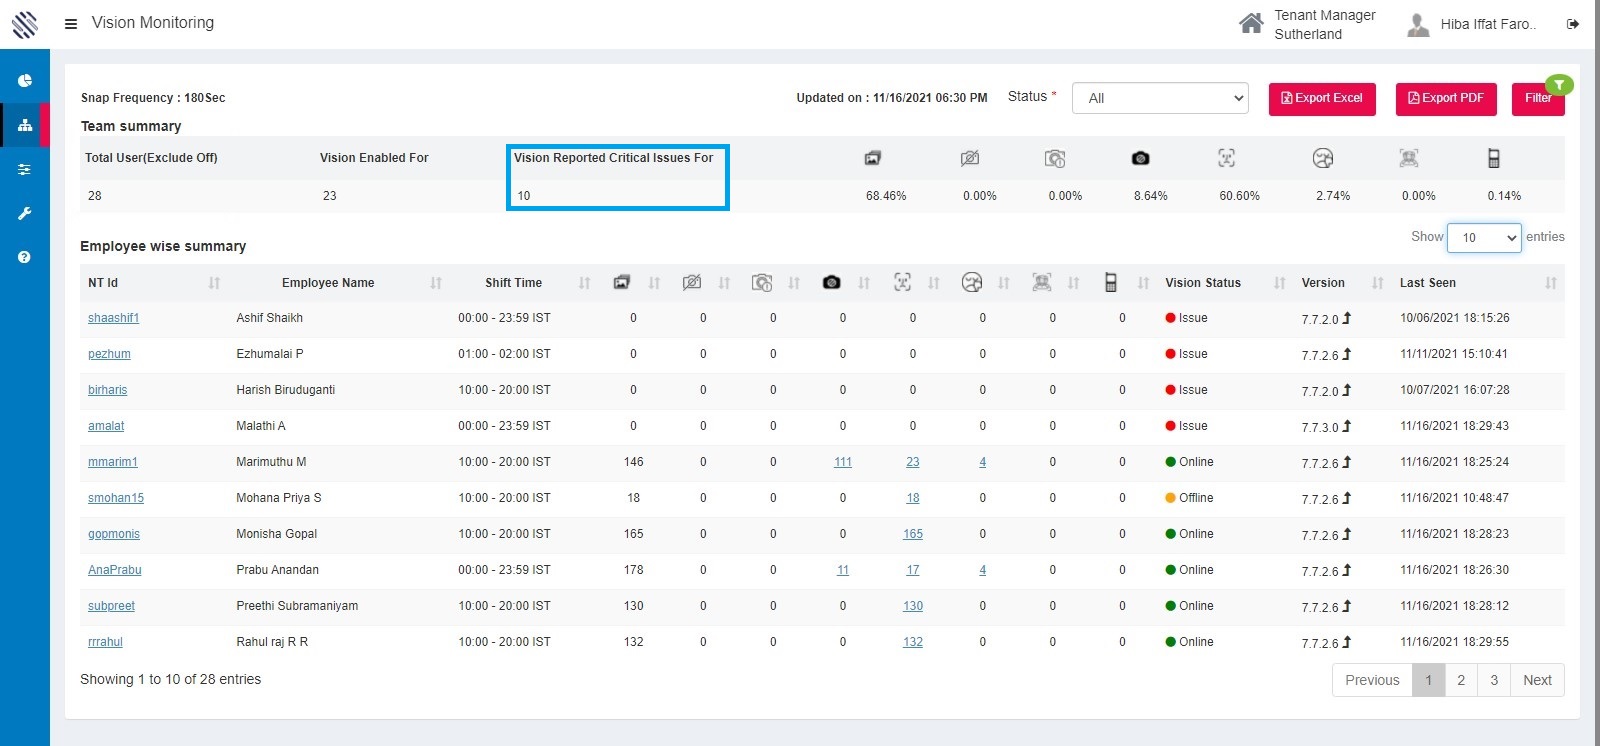
Figure 22
Total photos received:
Total photos receiving from the user’s computer. If the user logged off or has locked the system, then sentinel AI is not active on the user’s machine.
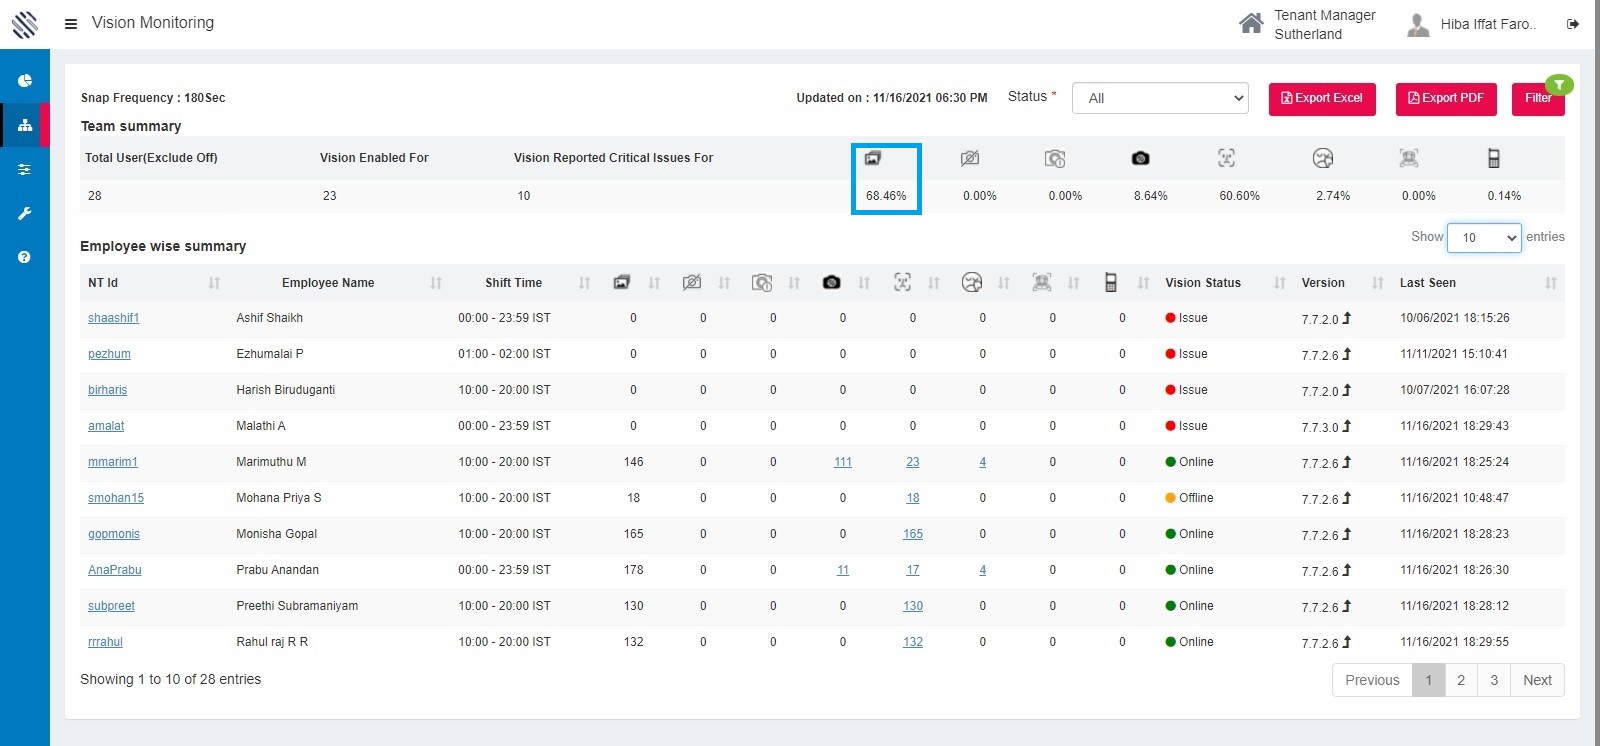
Figure 23
Camera not available:
This occurs when Sentinel AI vision is not able to access the hardware (webcam). The reason maybe due to physical hardware disconnection or failure .
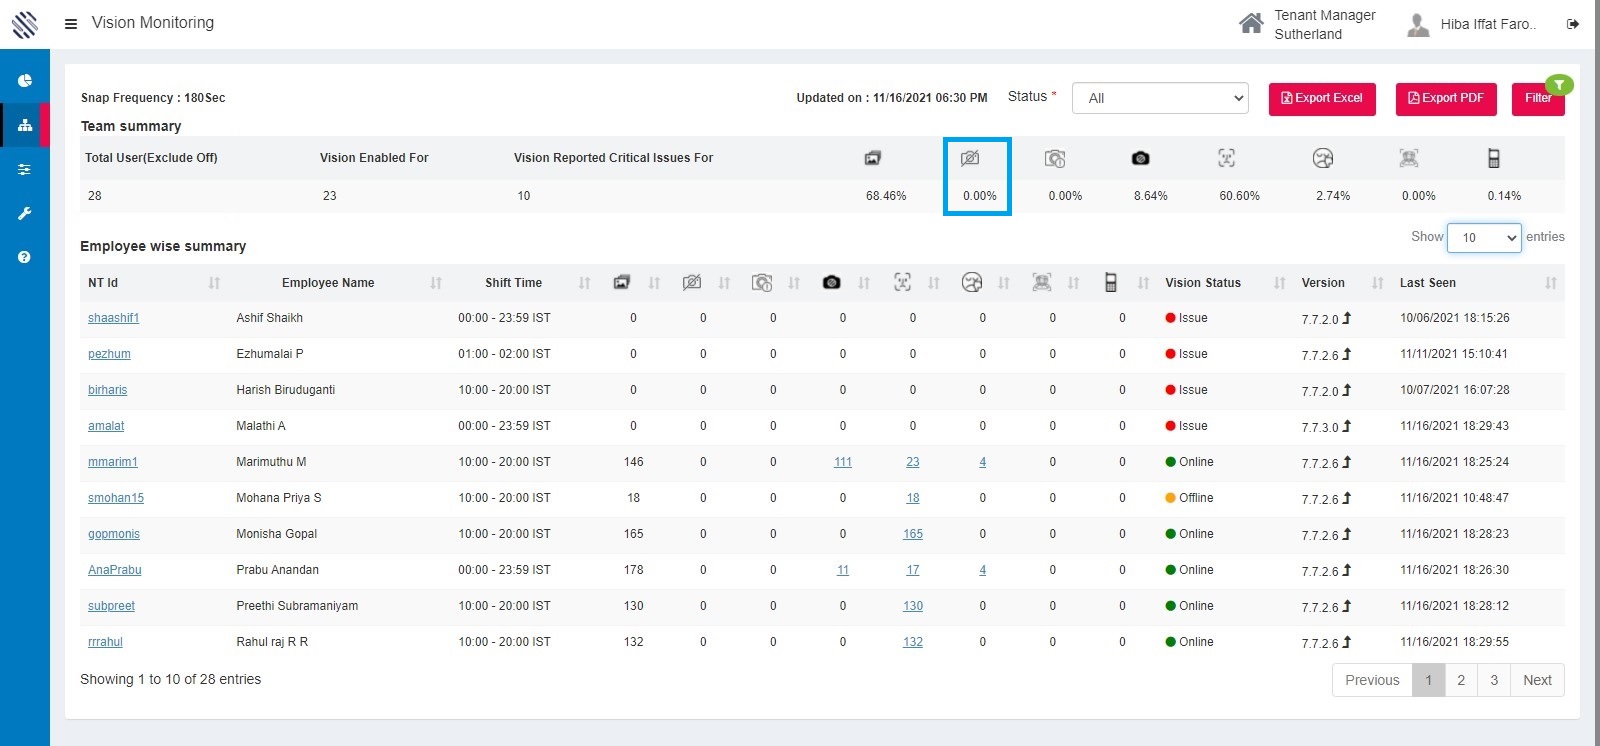
Figure 24
Camera busy: When any another application is using the camera like Microsoft Teams or Webex Meetings, the Sentinel AI cannot access the camera during that time.
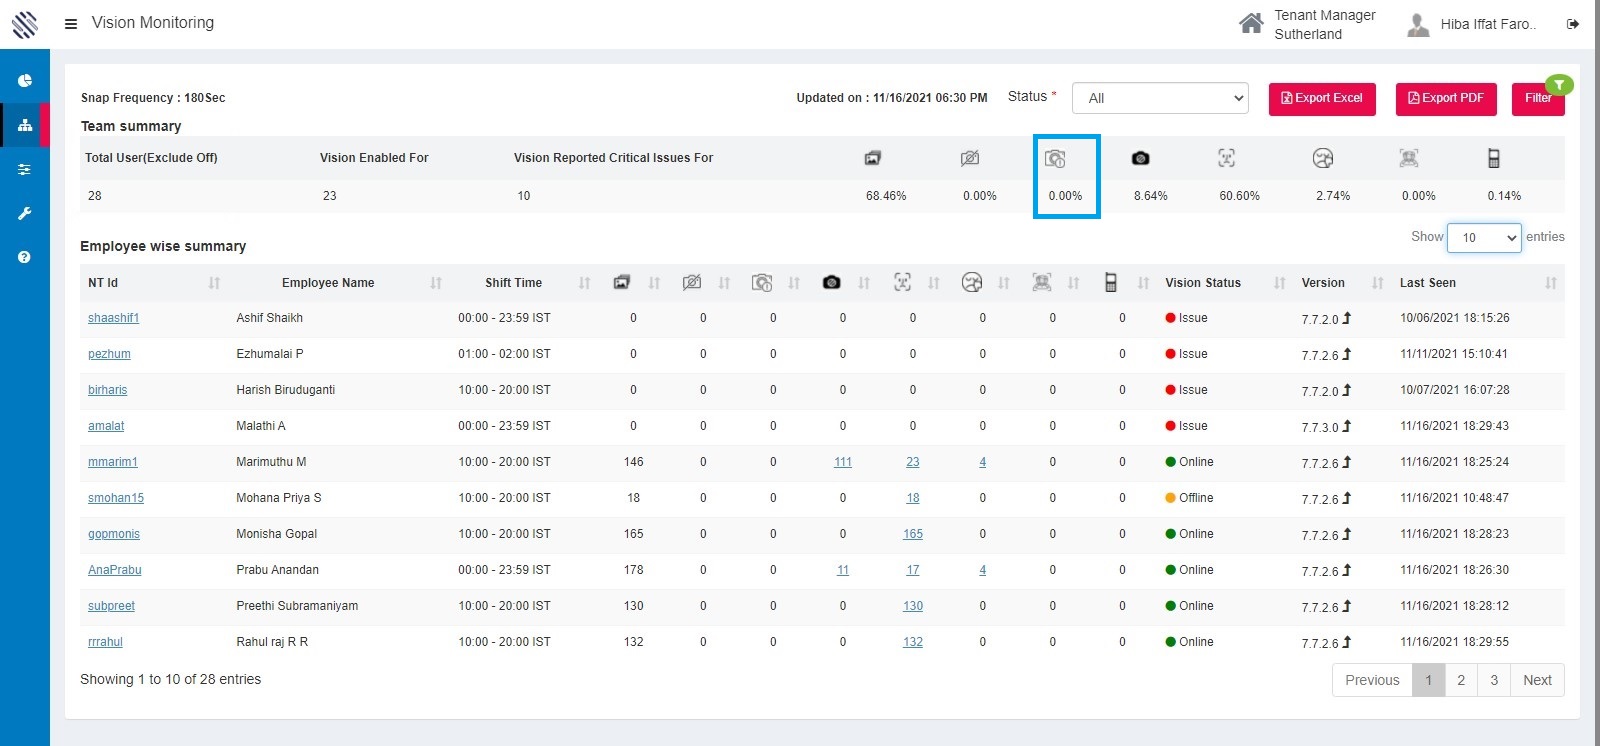
Figure 25
Lens closed: When the users closes the shutter of the camera lens, the images captured will be reported as too dark in the report.
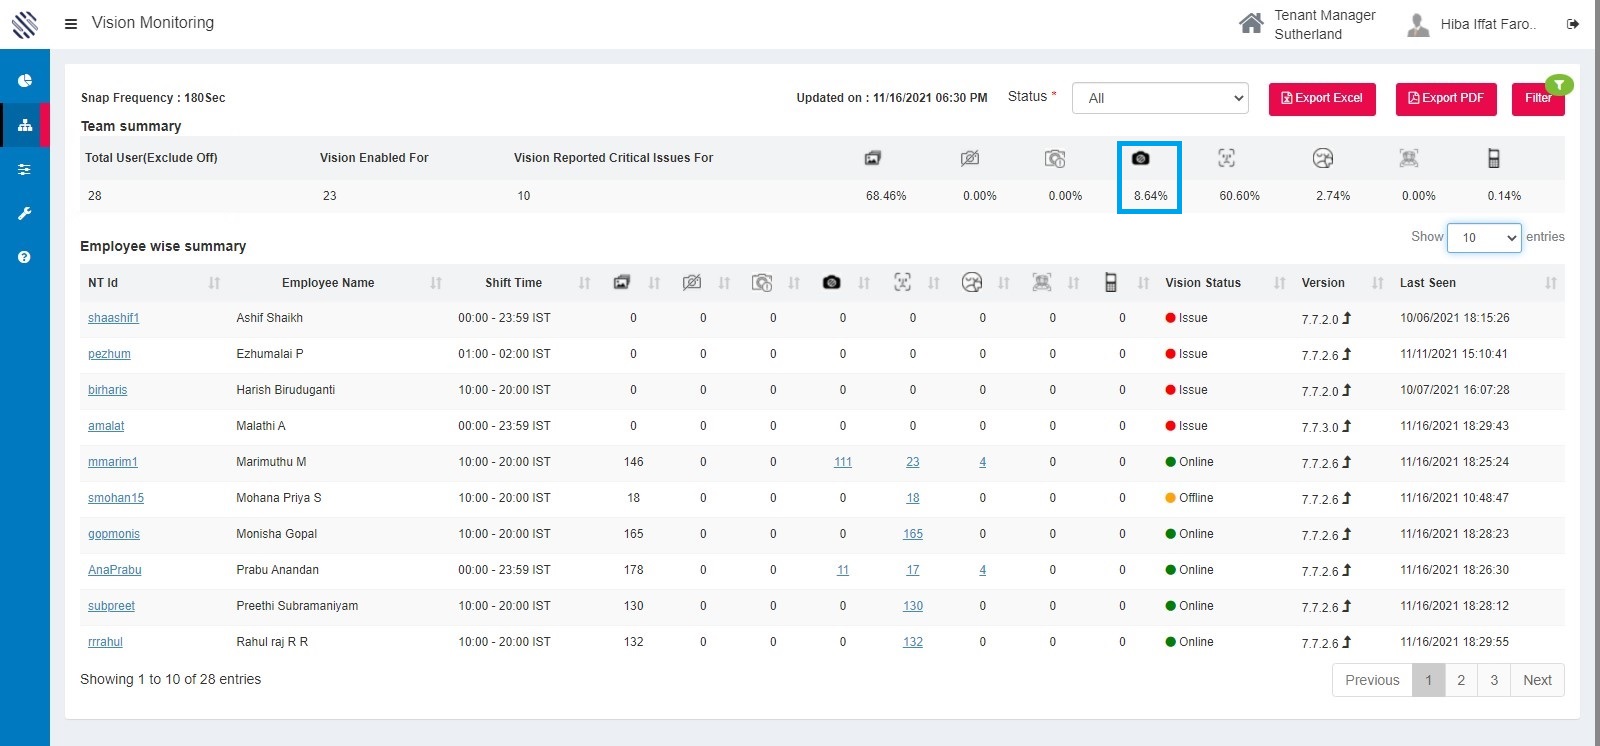
Figure 26
Face not detected:
This happens when webcam is being obscured or being faced at wall or when the images are too bright.
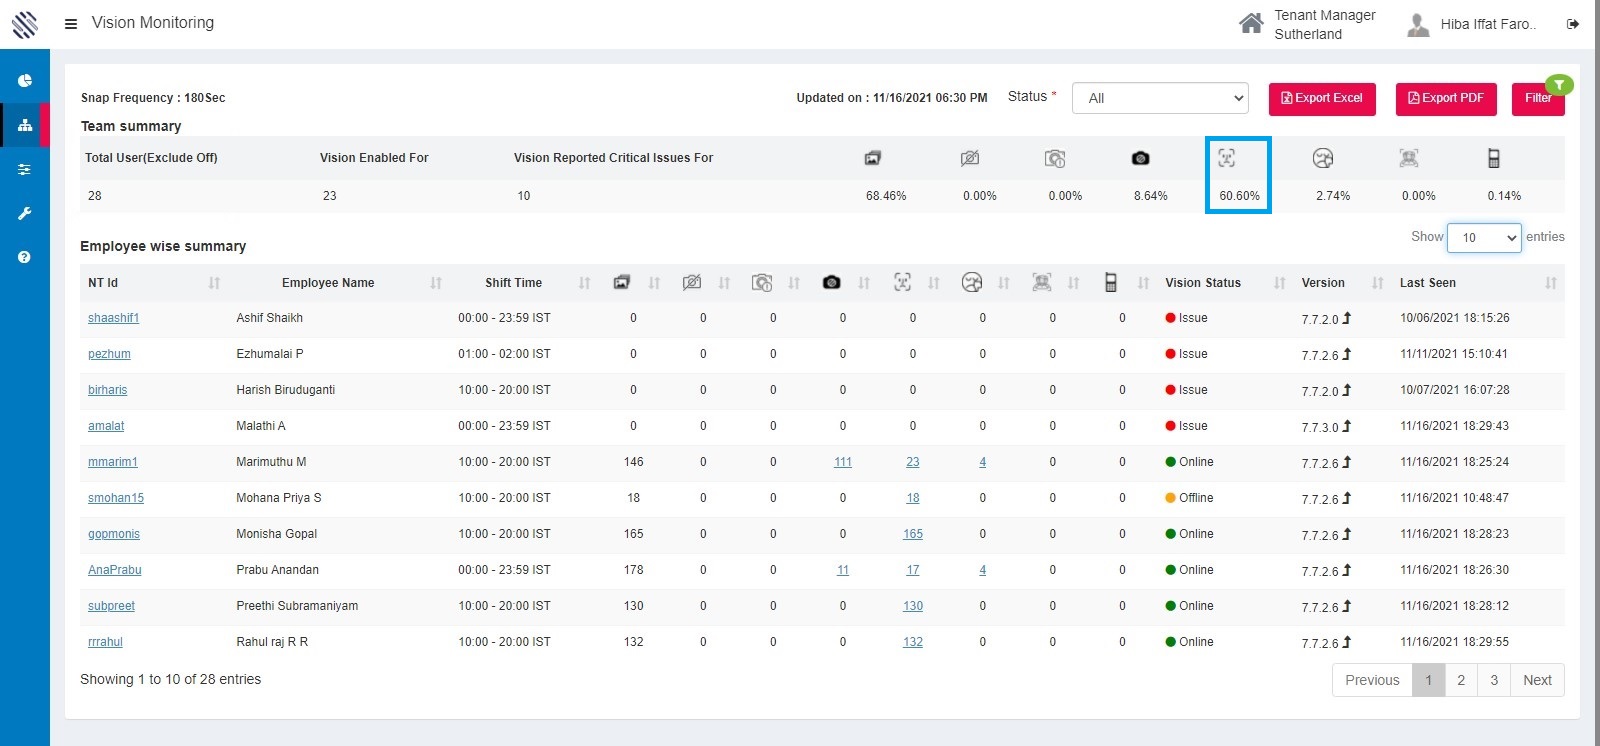
Figure 27
Face not matching:
This basically happens the when the face registered is not the actual face. To avoid those errors the users are advised to lock the system when they are not in the workstation.
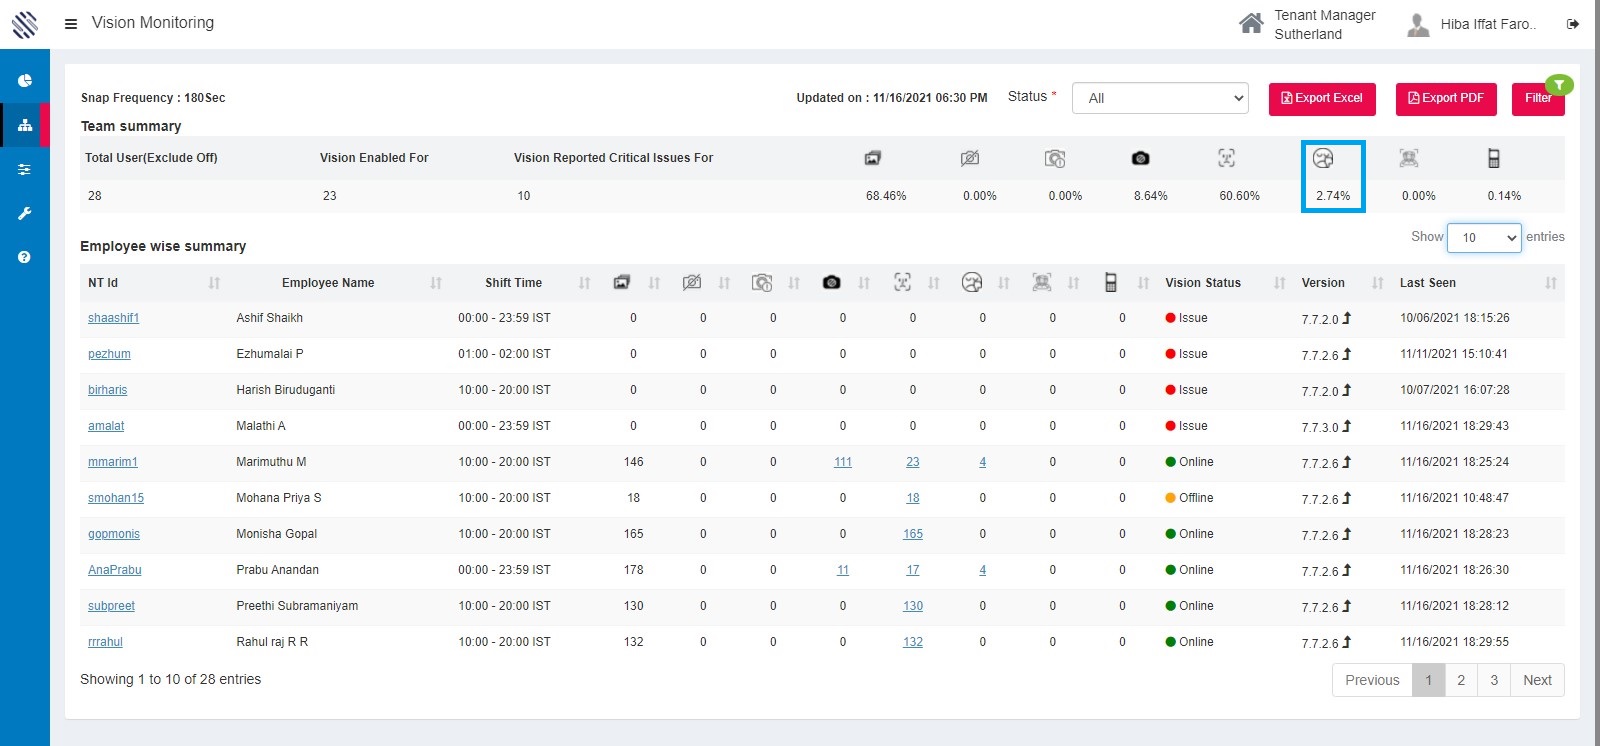
Figure 28
More than one face detected:
A higher number here indicates that there is a good chance of shoulder surfing, or another un-authorized user’s presence is detected by the system.
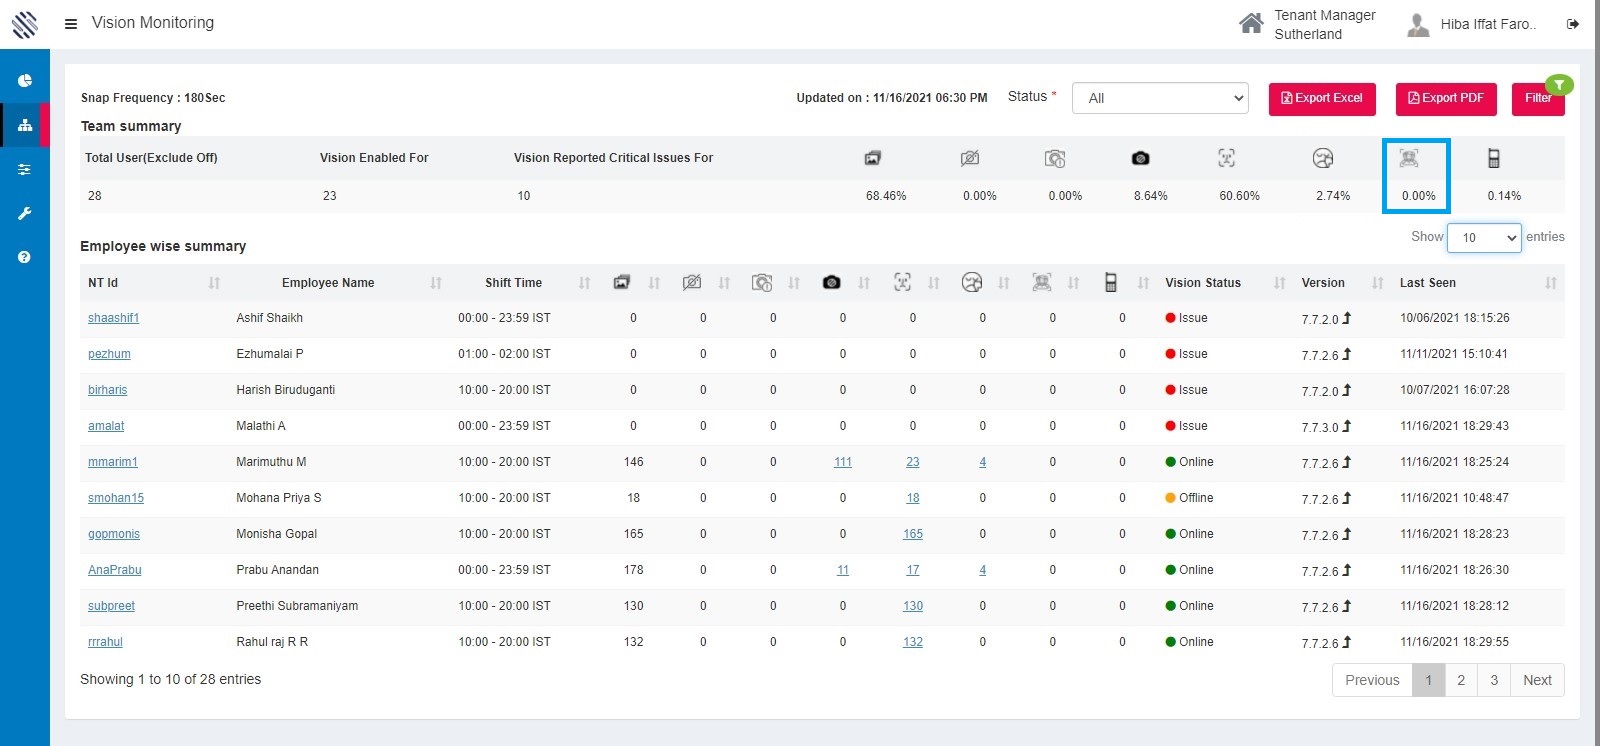
Figure 29
Cell phone detected:
In order to protect the customers or client’s information, the users are prohibited using mobile phones while in the workstation.
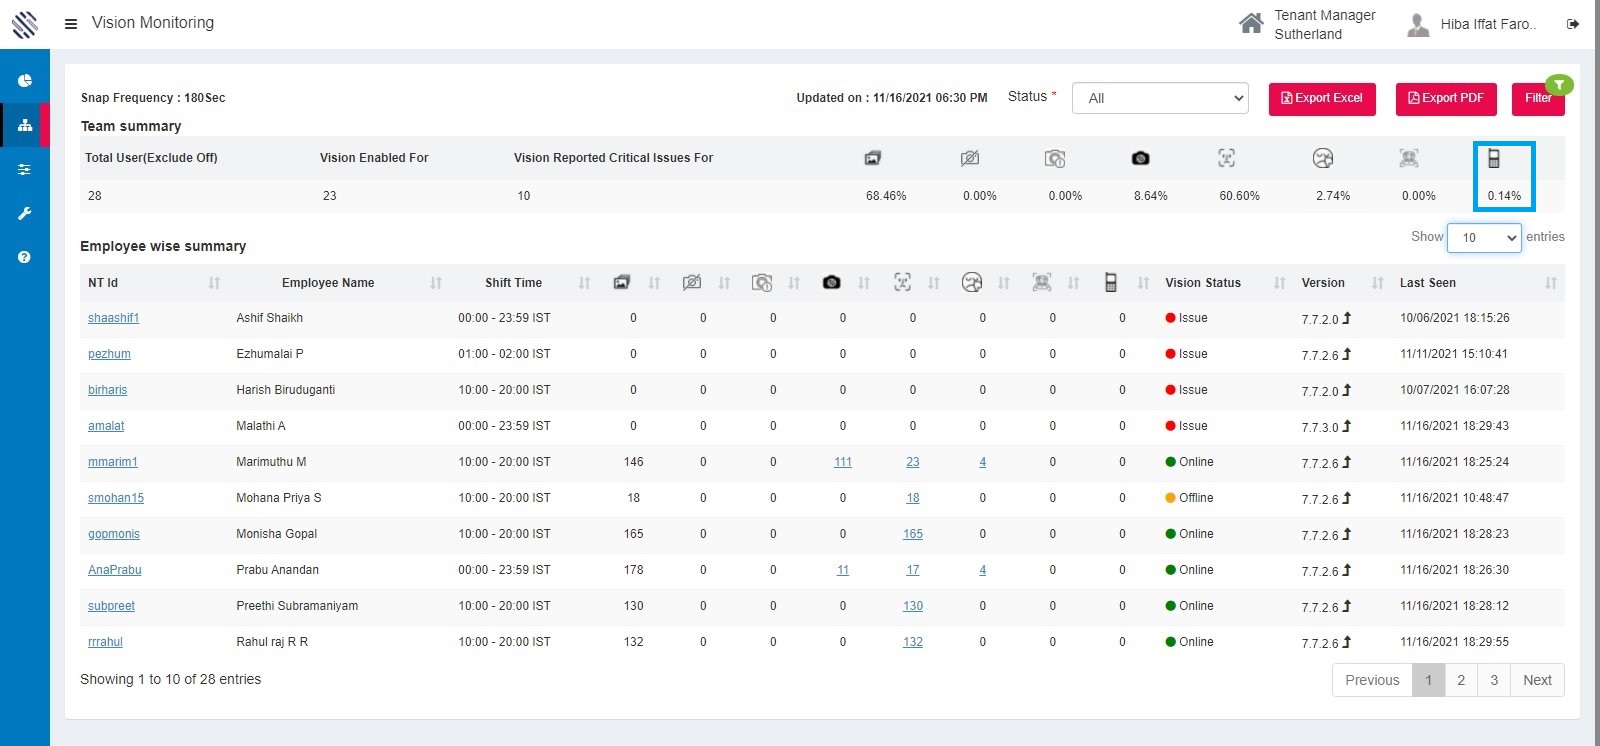
Figure 30
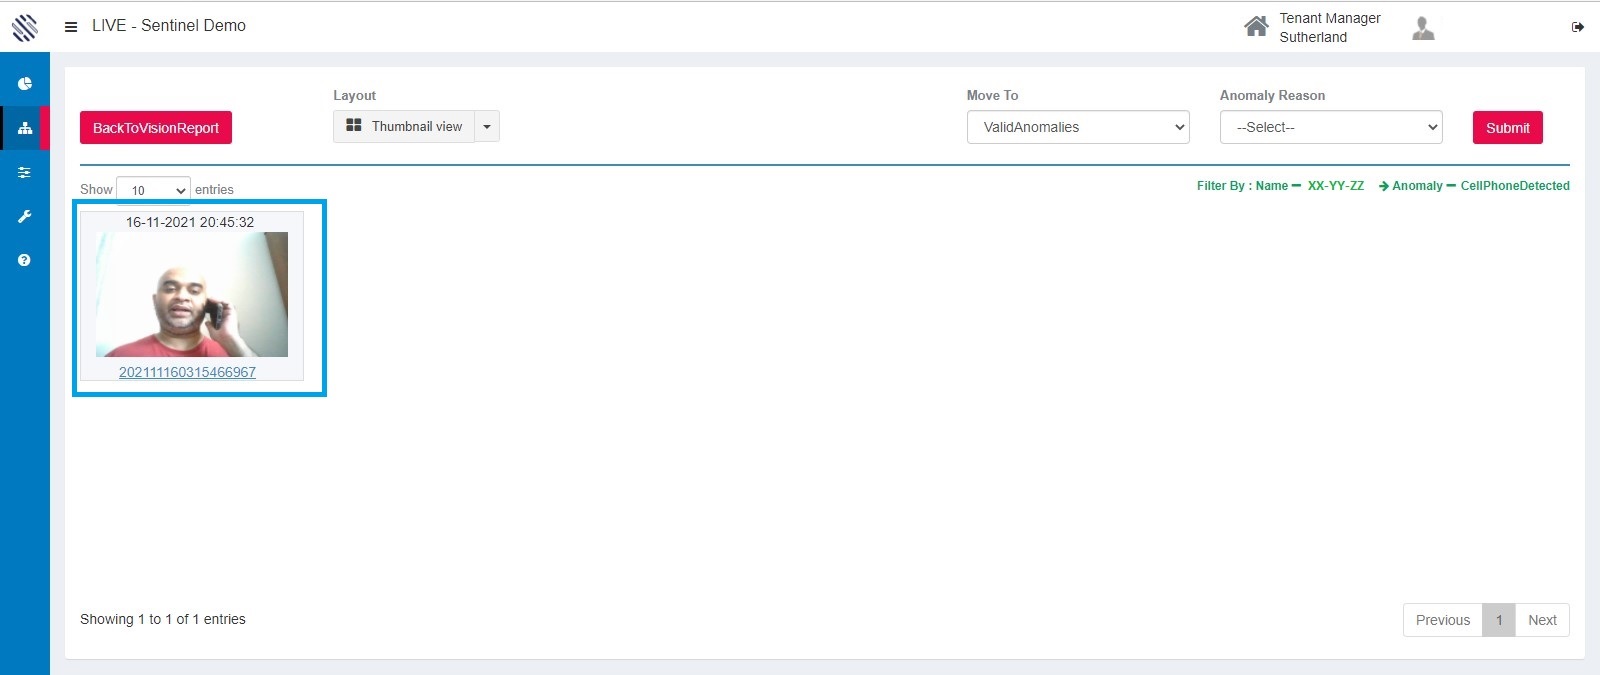
Figure 31
Employee wise Summary: Team member anomaly breakdown for users on shift. This list will also include users who are on their week off.
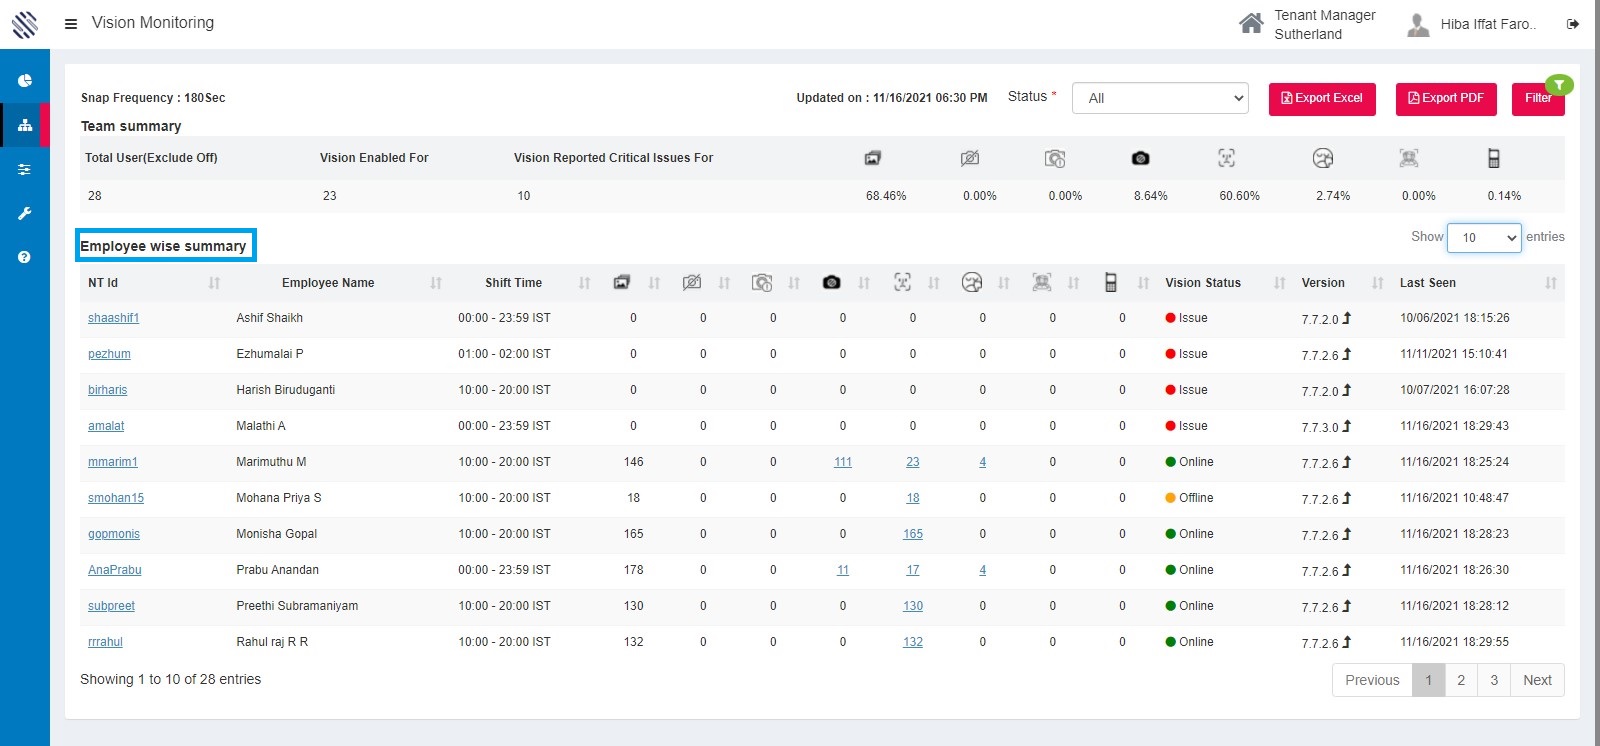
Figure 32
- NT ID: In vision report, when the user’s NT id is clicked, a pop- up is appeared. The pop-up gives you the user’s latest information.
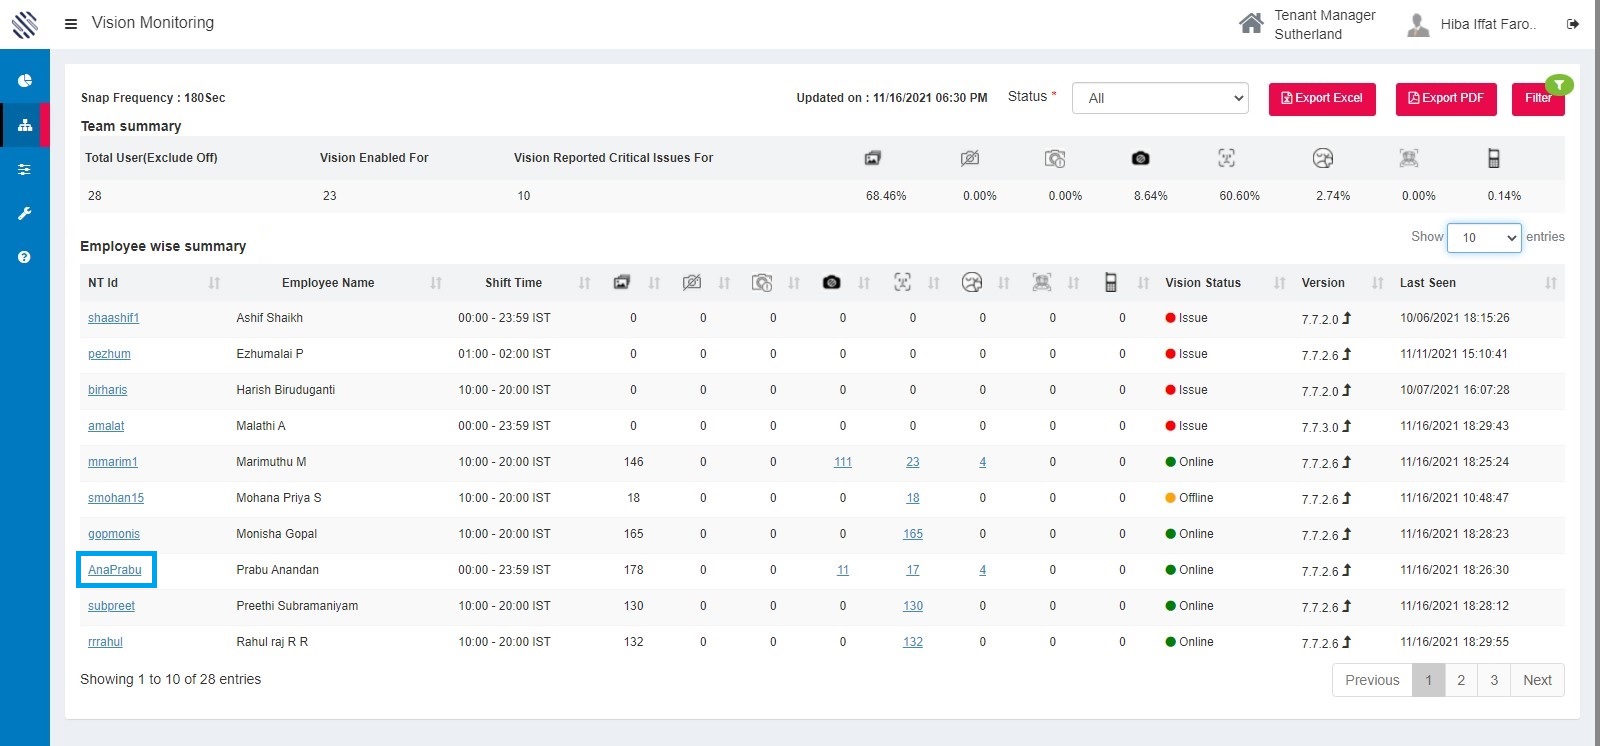
Figure 33
By clicking on the NT ID URN, a pop- up appears with details. (like User NT ID, First name and Last name, User agreed, Machine name, IP address, Last seen, Comments, Total RAM, OS Information, MAC Address, Sentinel version and login type.)
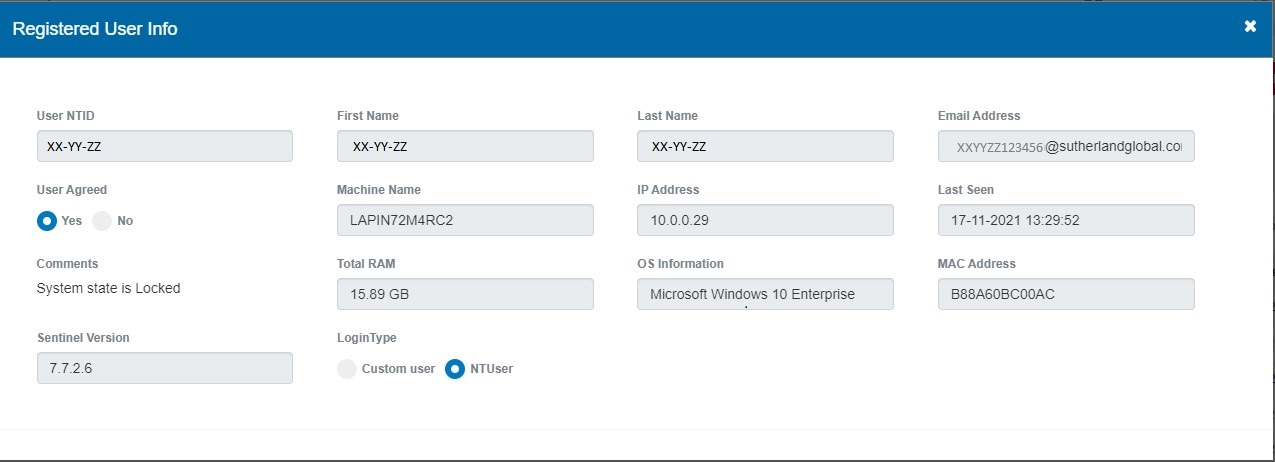
Figure 34
2. Employee Name: It displays the employee names respective to their supervisor.
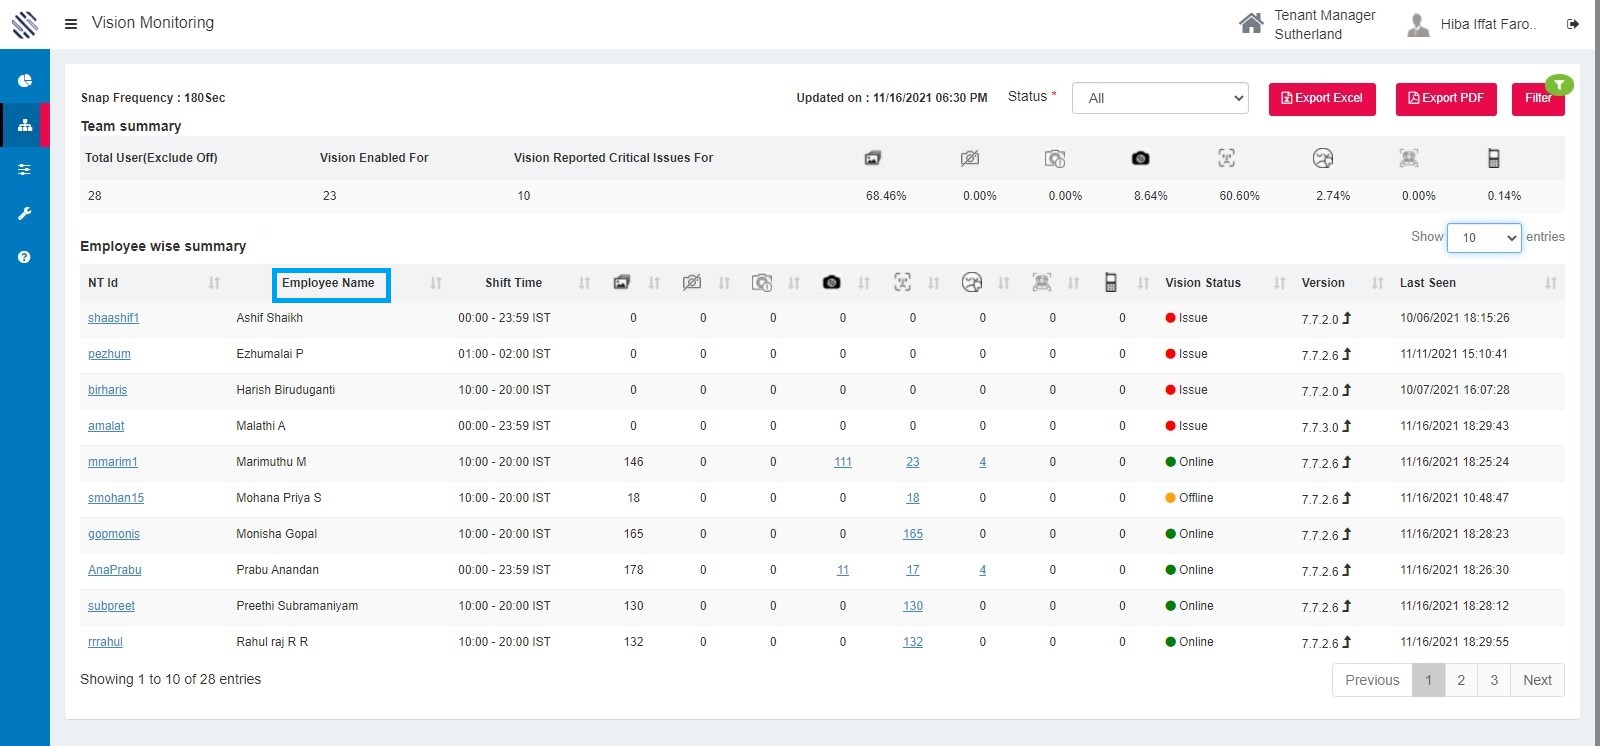
Figure 35
3.Shift Time: It displays the shift timing of the employees in the grid.
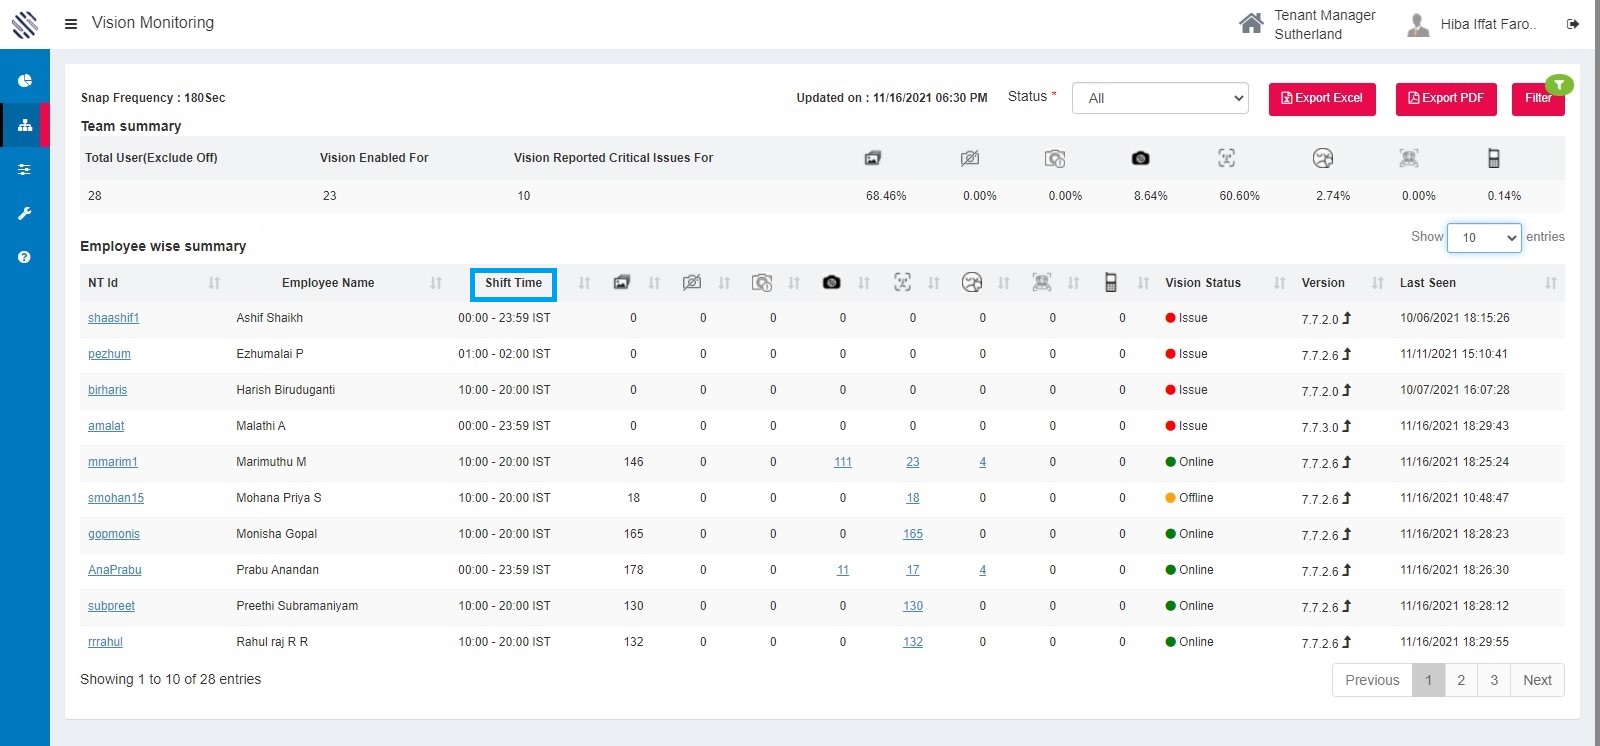
Figure 36
4. Vision Status: It displays the status of the employees whether they are Online, Offline, or having Issue. It also shows whether there is Registration pending.
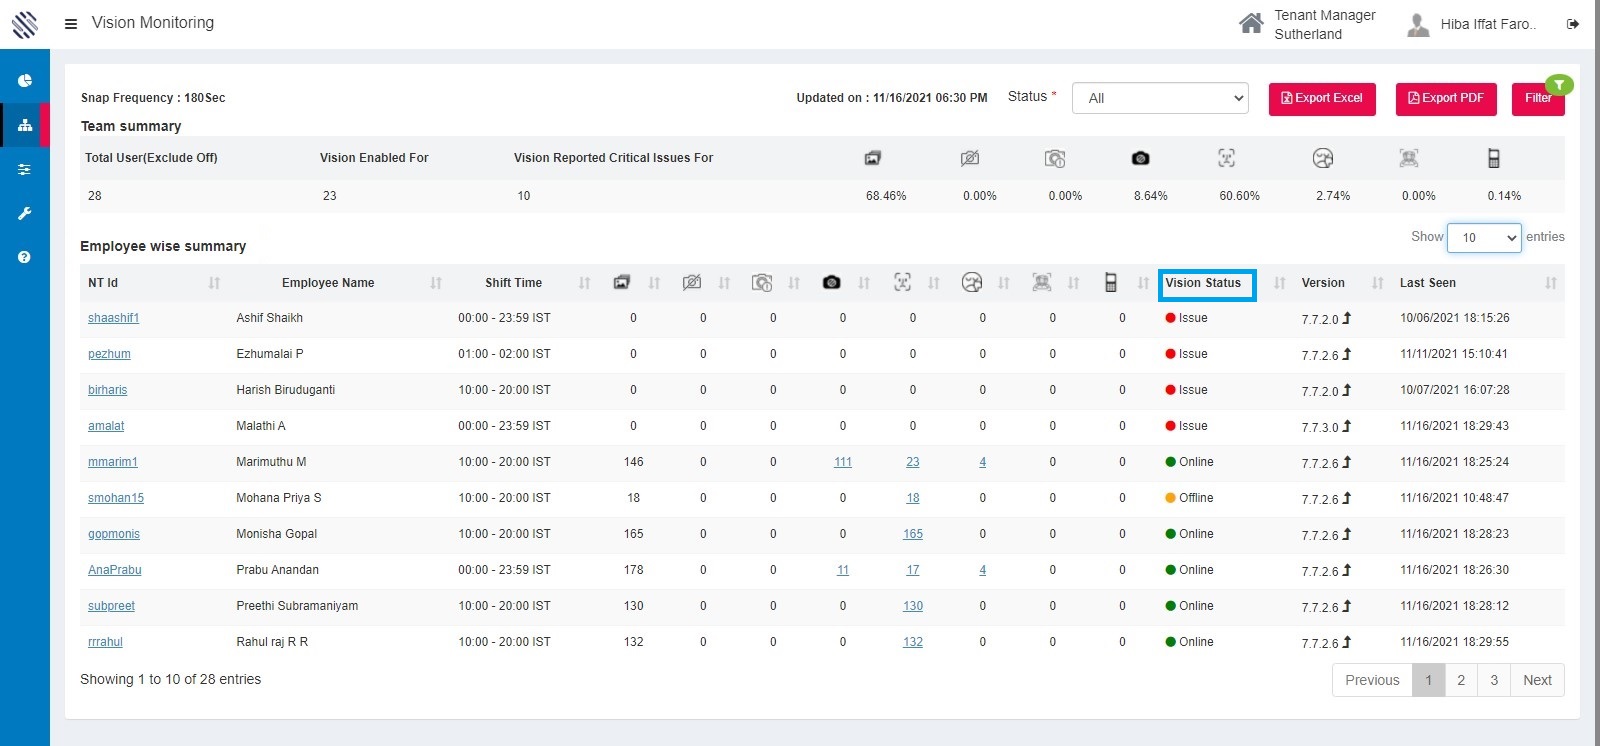
Figure 37
In vision status column, the status issue with hyperlink refers to the error code reported by the application in the system.
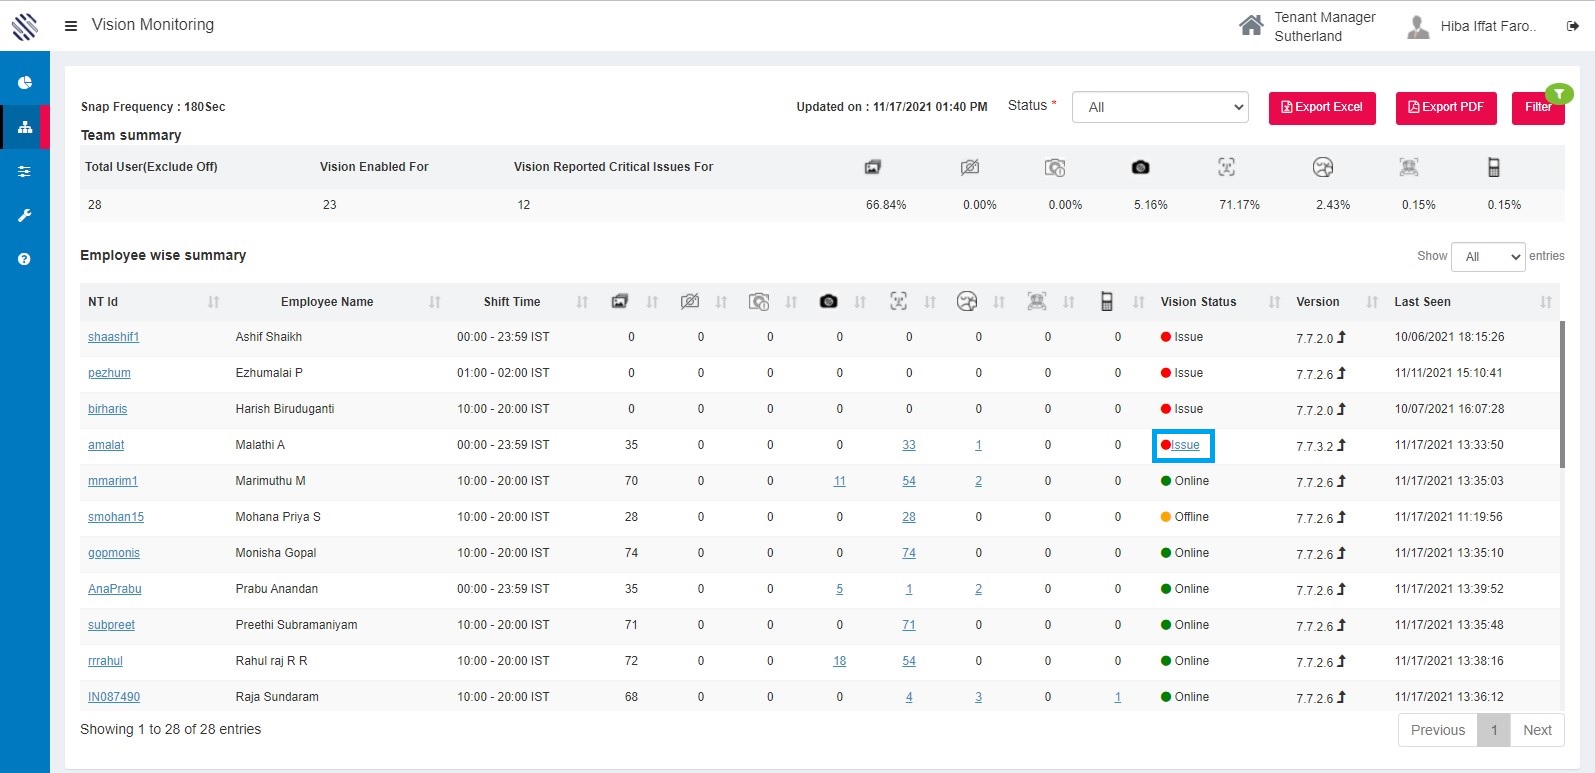
Figure 38
Clicking on the hyperlink redirects the user to the resolution page.
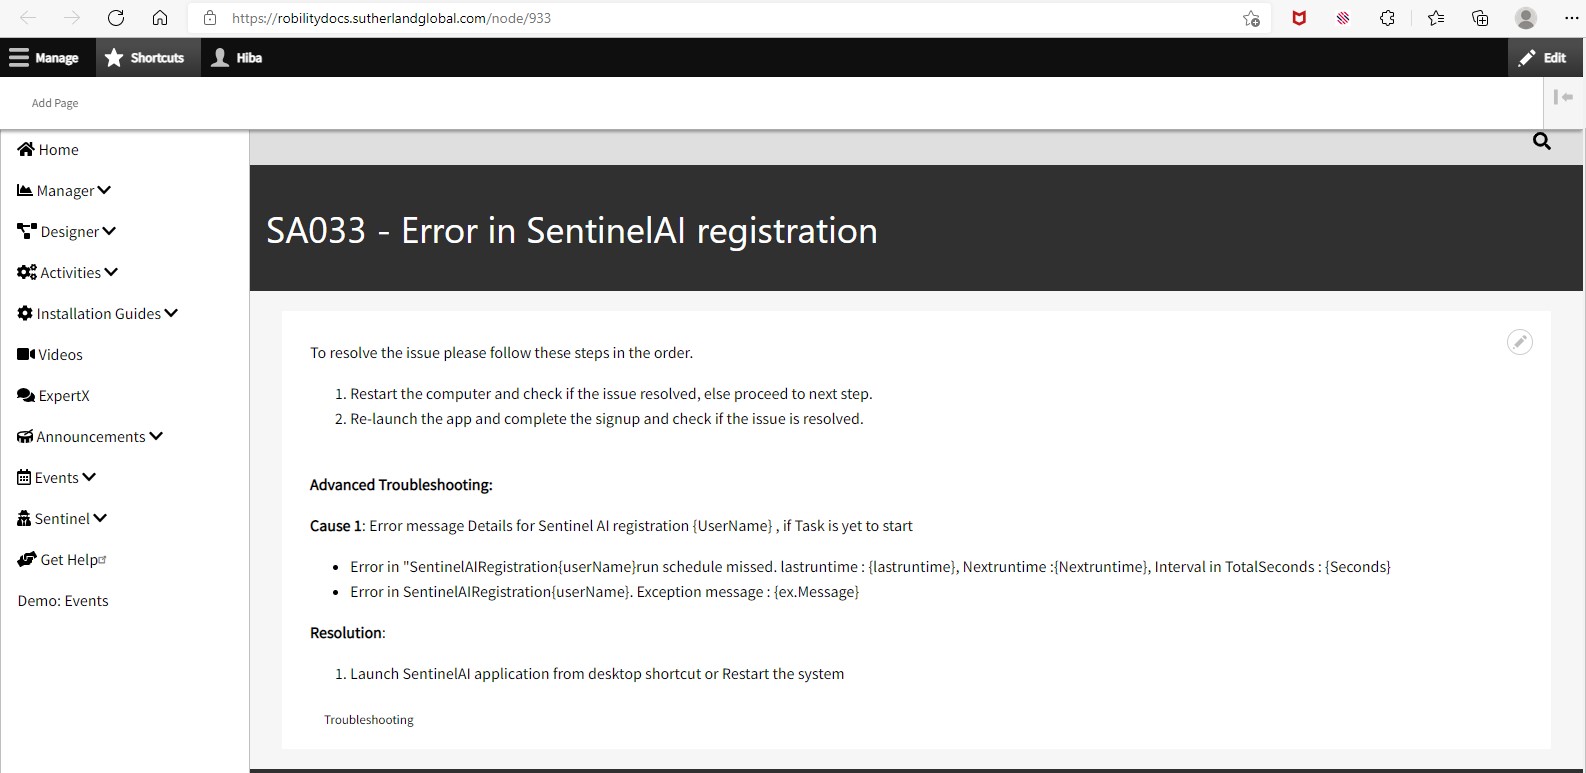
Figure 39
5. Version column: This helps to know the version which the user has installed and using it currently. The upgrade icon near the version number indicates the availability of latest version and reminds the users to upgrade
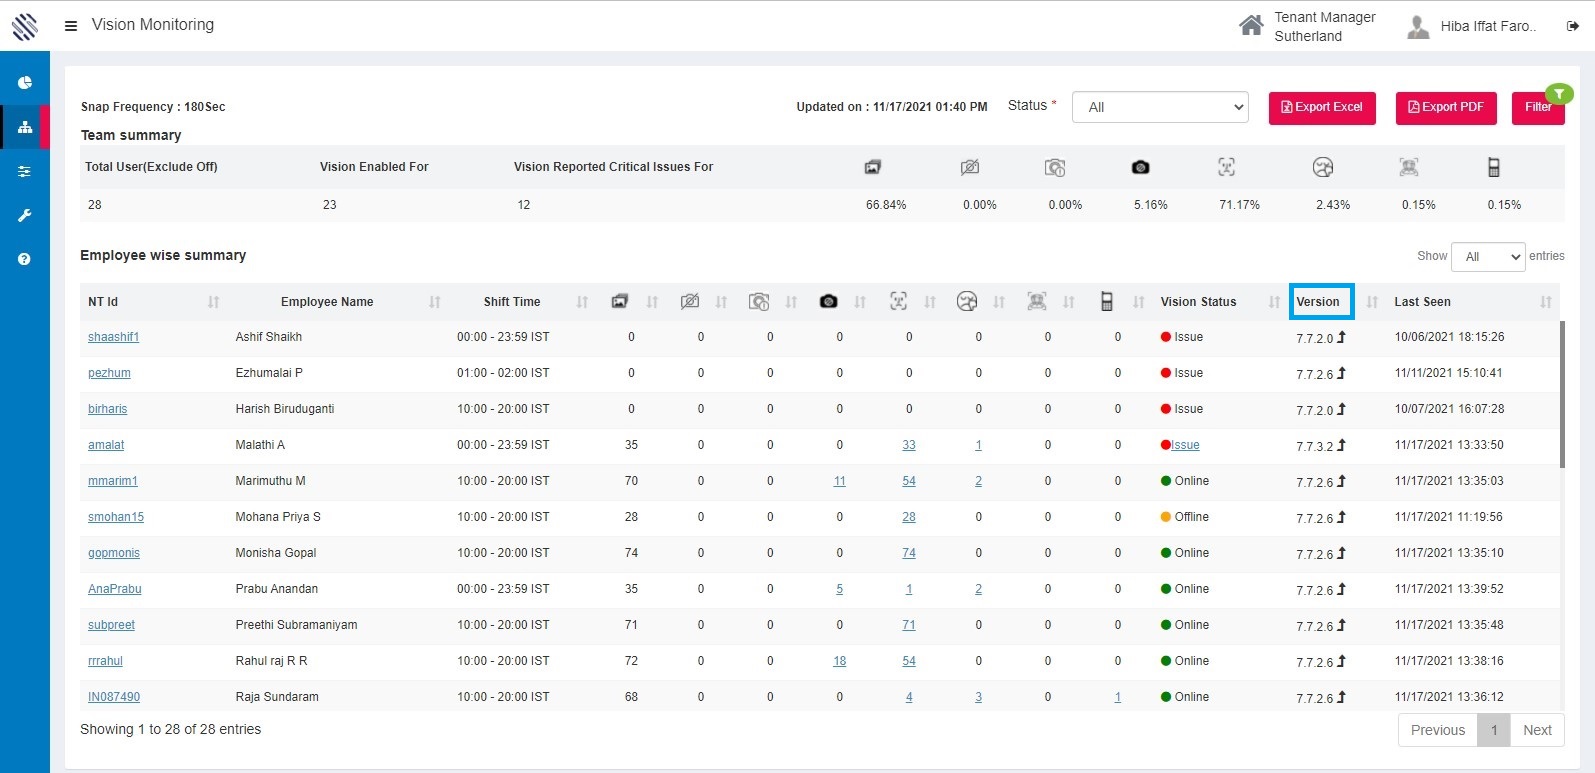
Figure 40
6. Last seen column: This column displays the last status which has been received from the user.
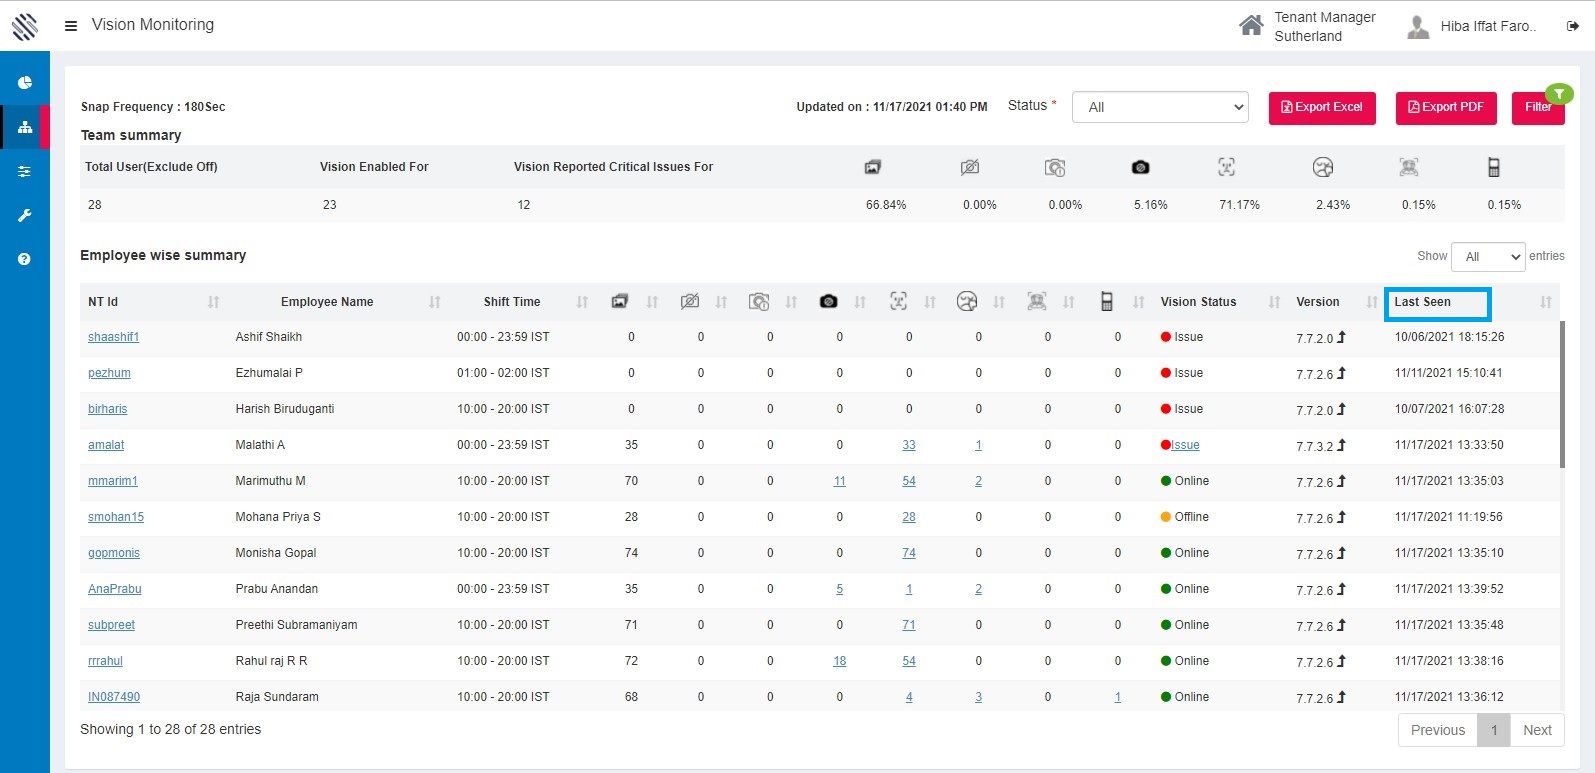
Figure 41
Filtering: The filter option near every column filters the data by ascending or descending order by clicking on it.
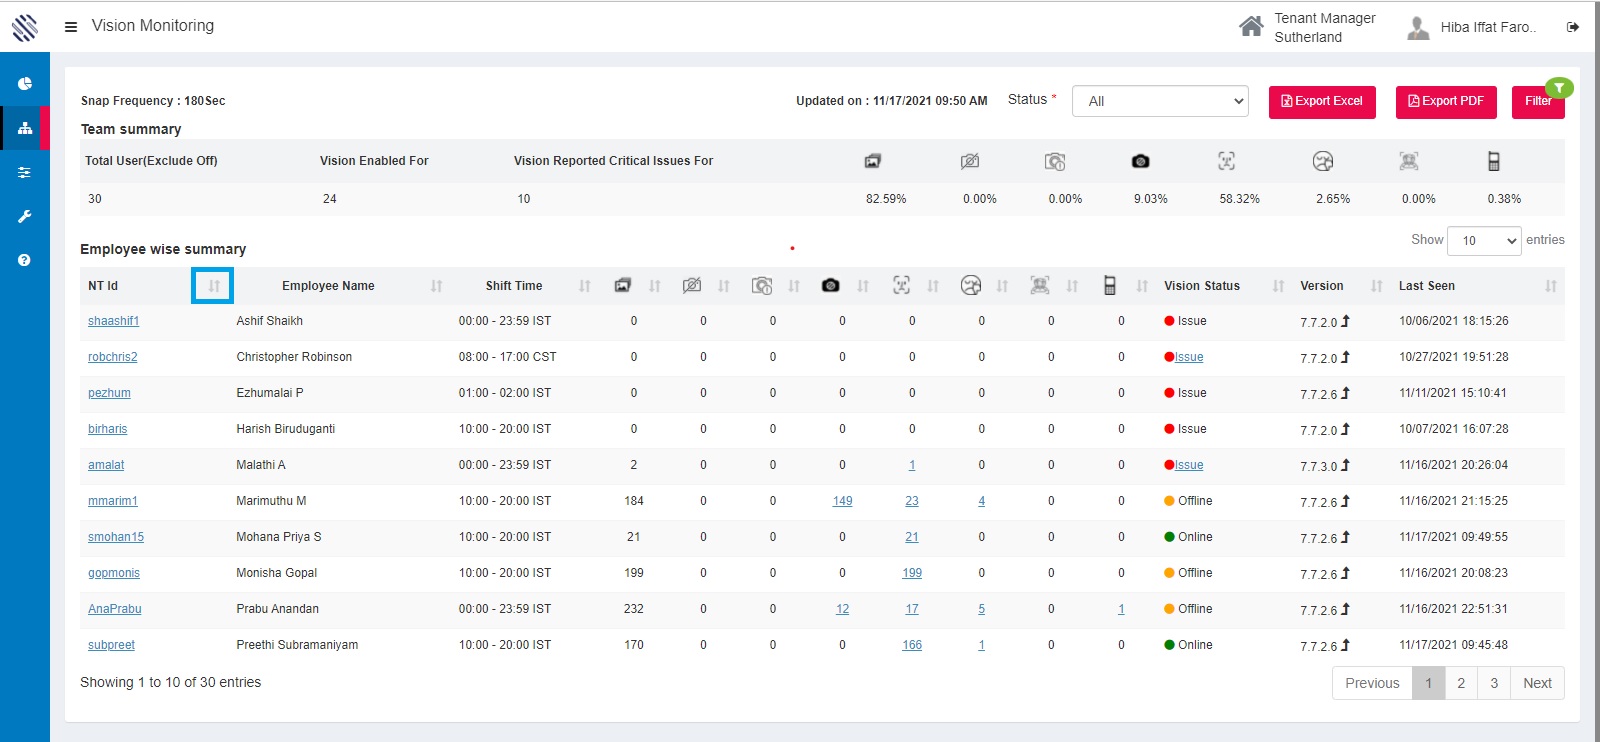
Figure 42
Select the button once, it will re- arrange the data in Ascending order.
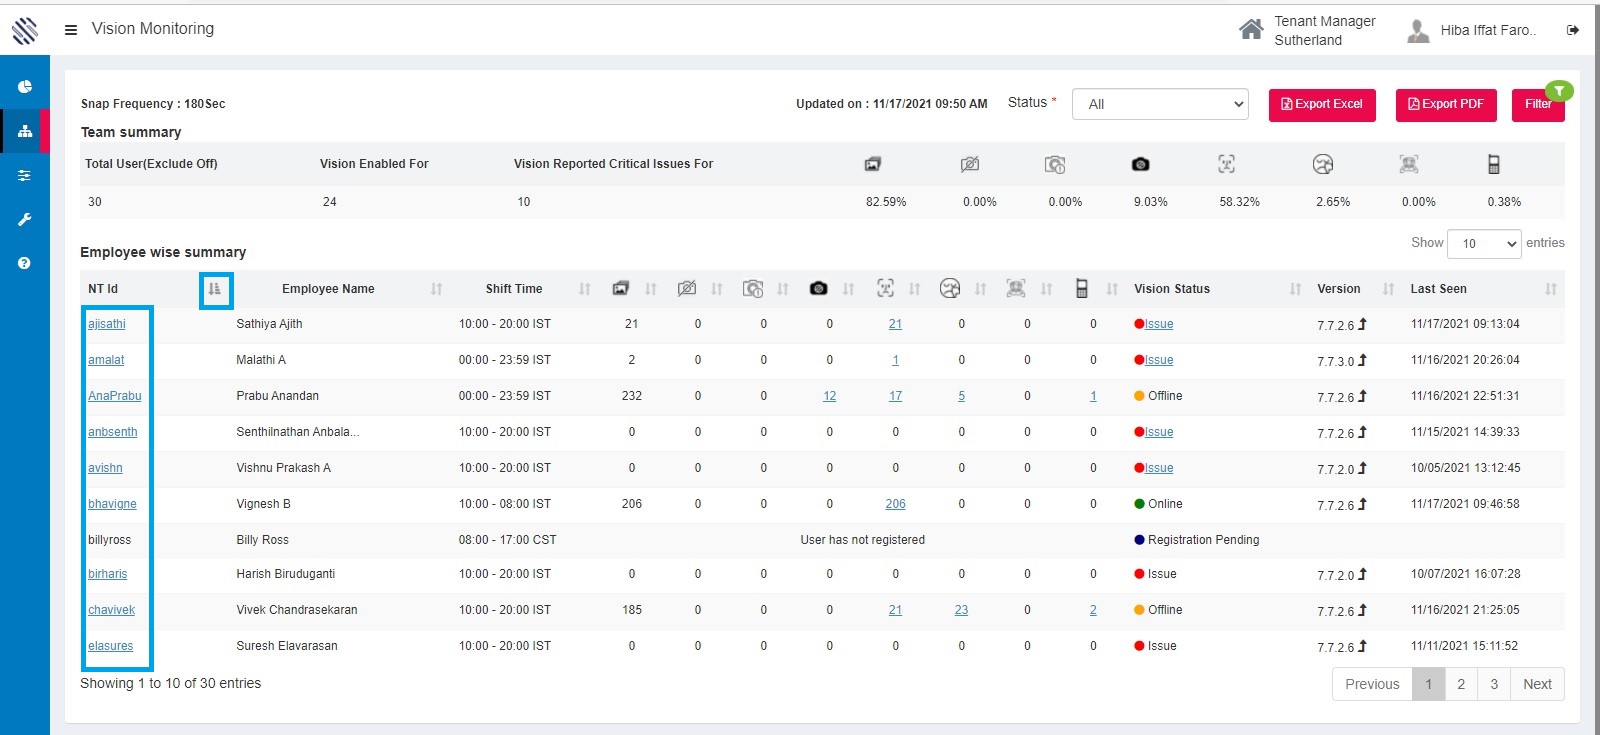
Figure 43
Select the button once again, it re-arranges the order in descending order.
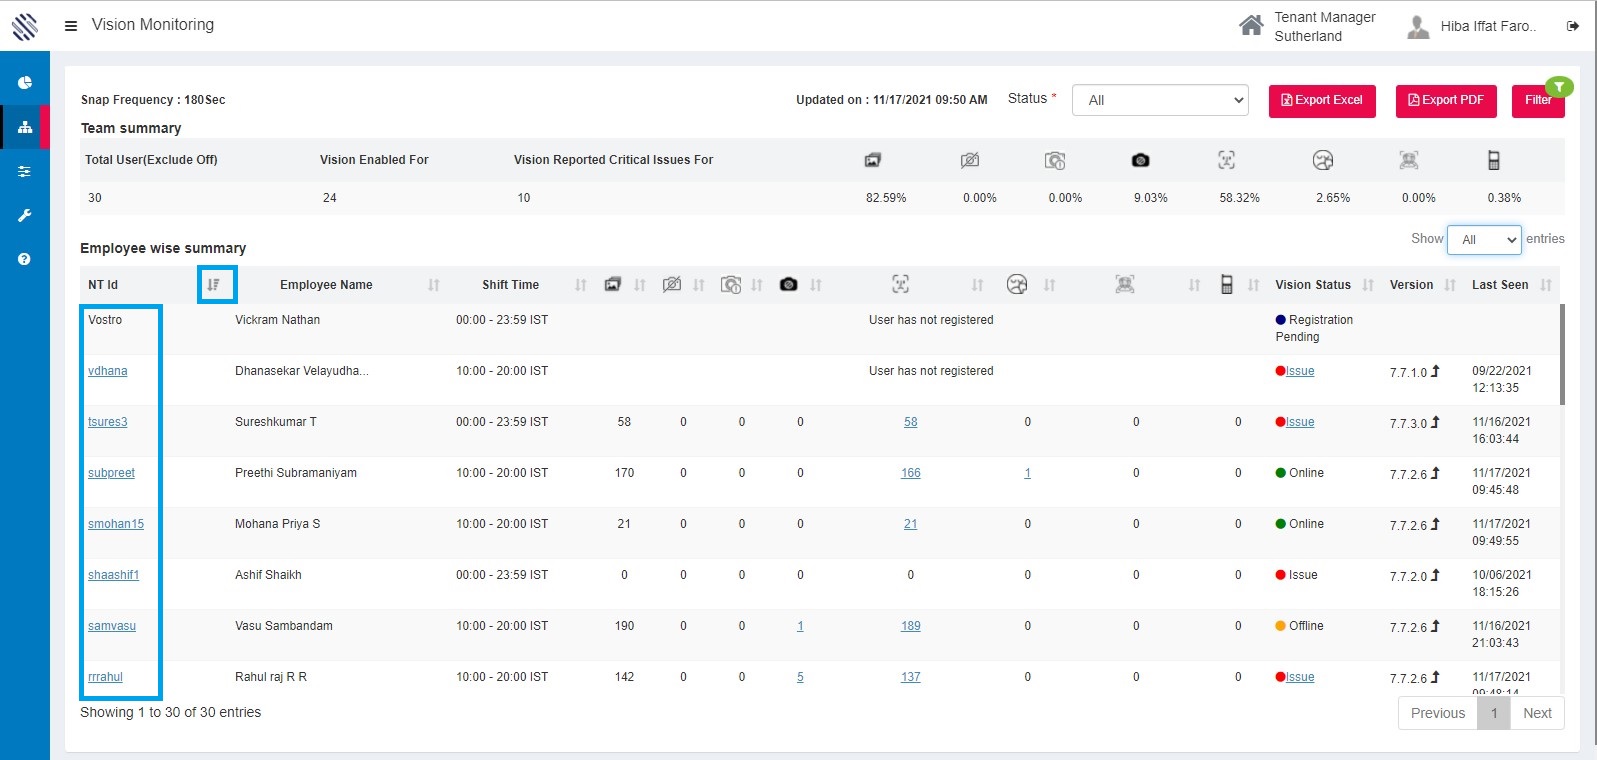
Figure 44
Anomaly review:
In the Face not Detected field, click on the hyperlinked number.
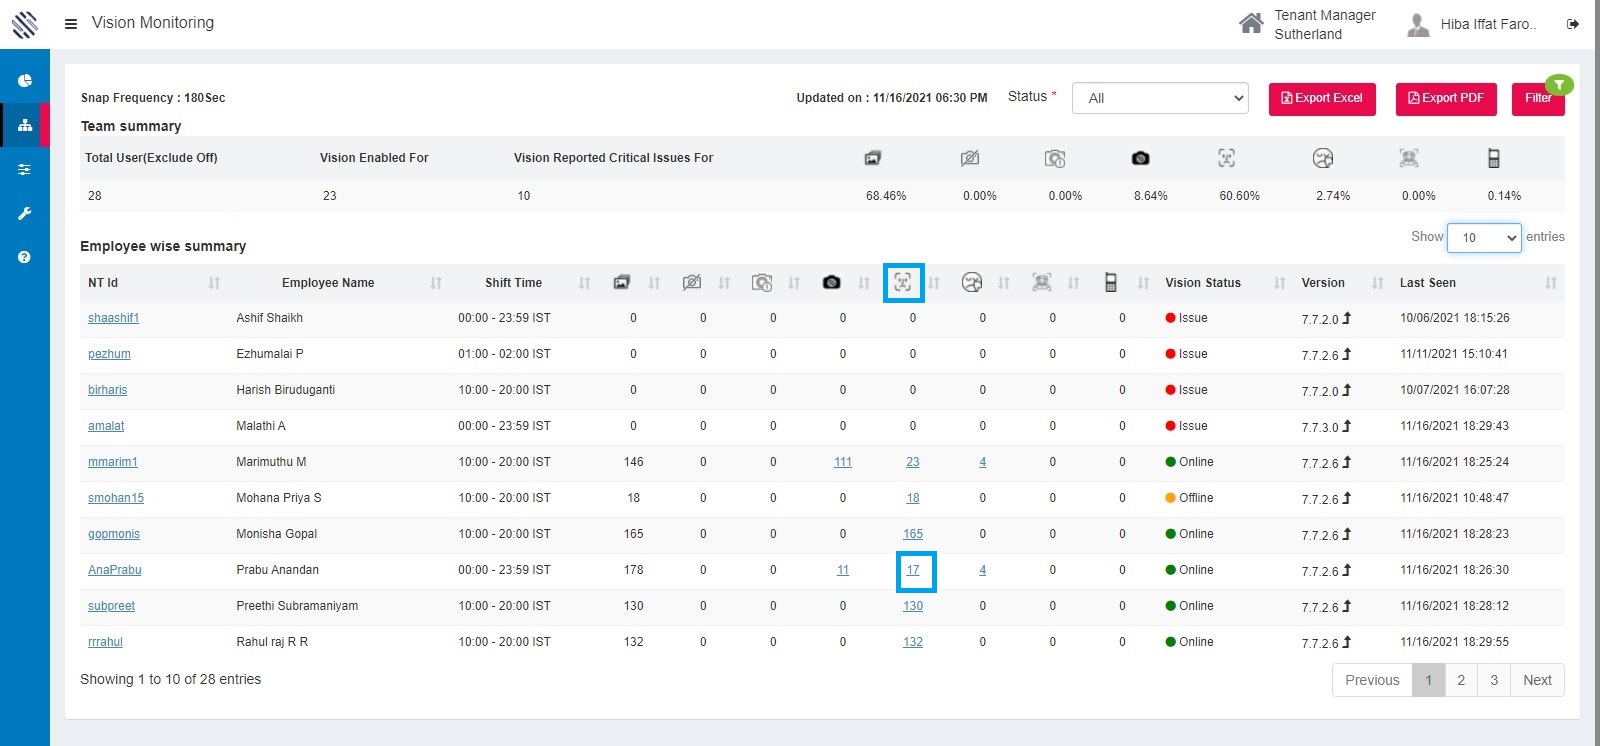
Figure 45
On clicking it, it directs the users to the Anomaly review page displaying the anomalies under face not detected in different layouts.
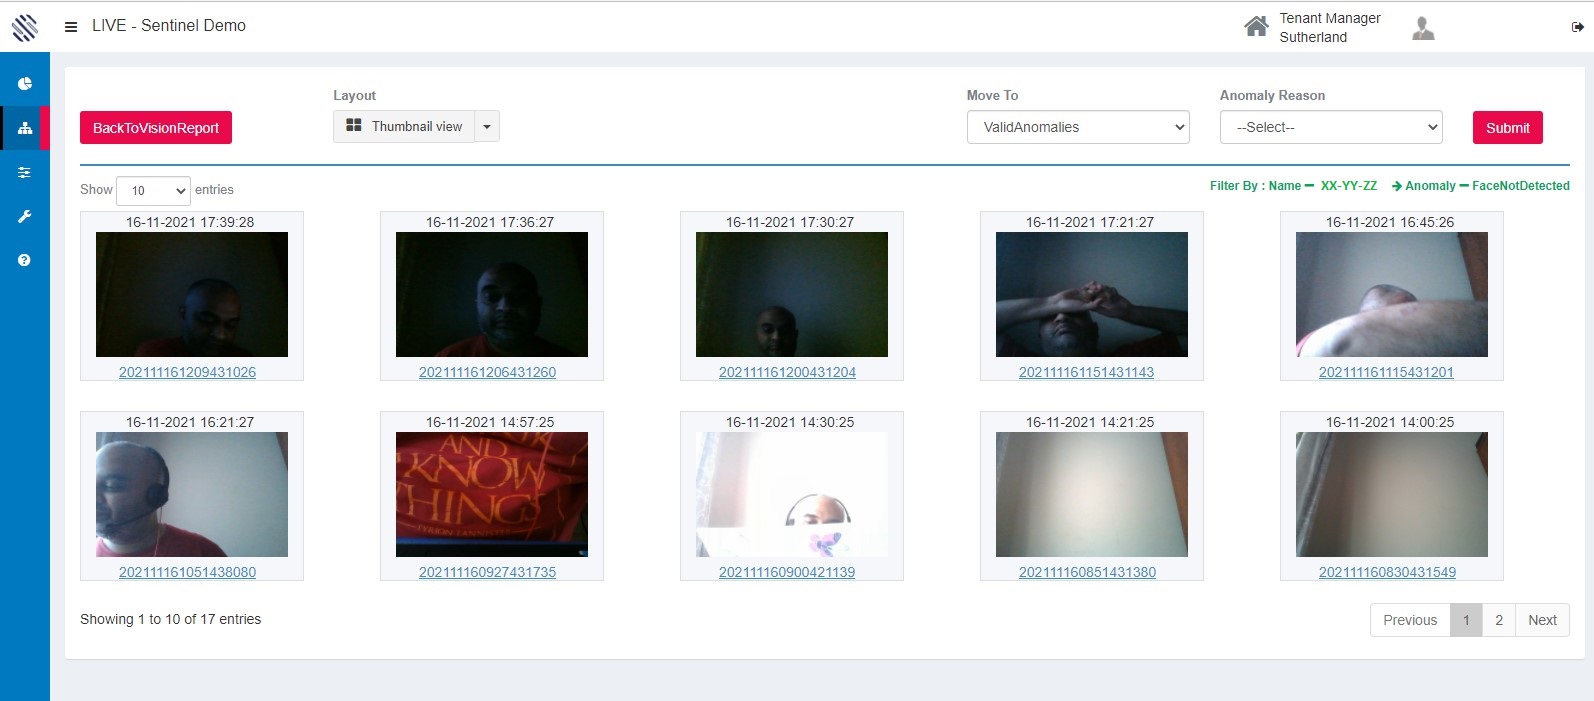
Figure 46
Layouts in anomaly review page has three features, "Thumbnail view" , "Detailed View" and "Normal view".
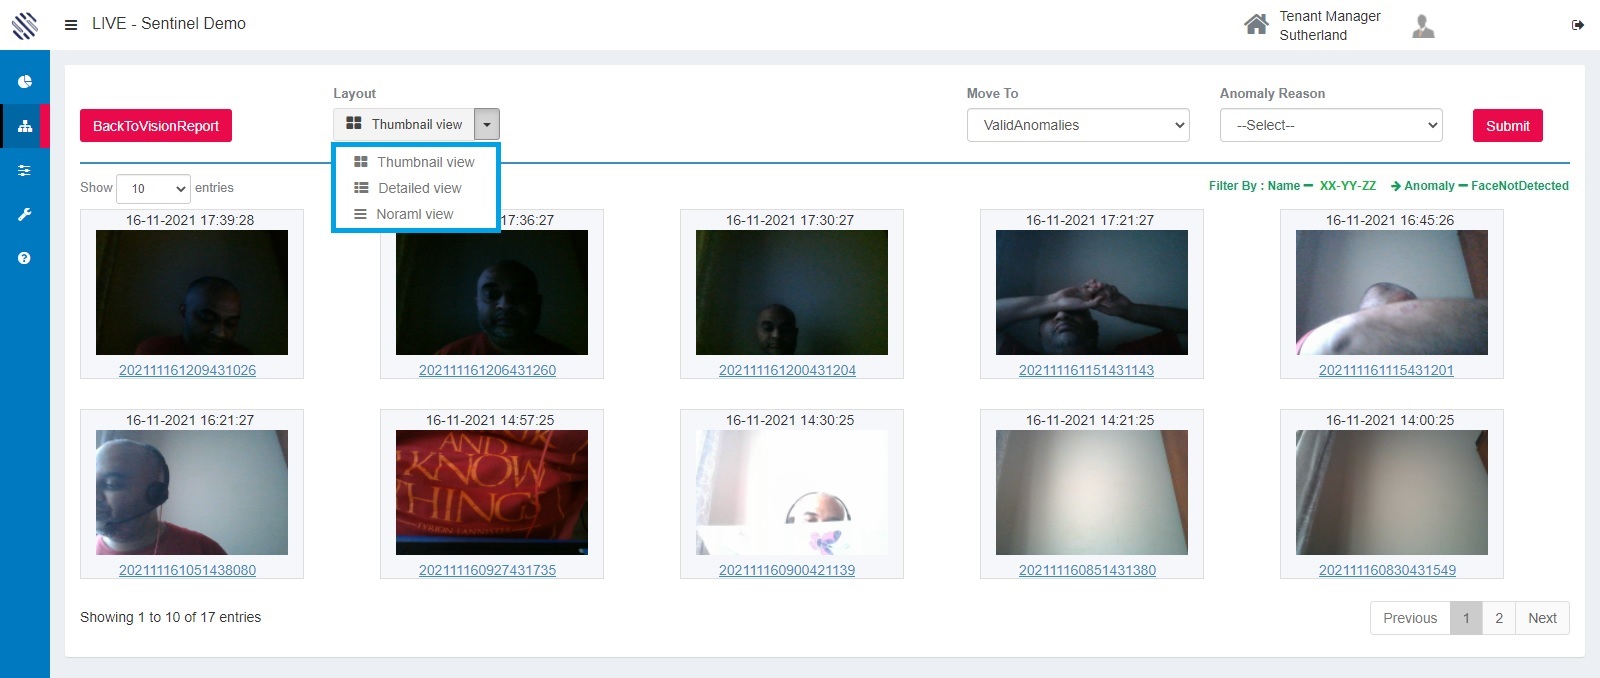
Figure 47
Thumbnail view: It displays the anomalies in a single view alignment.
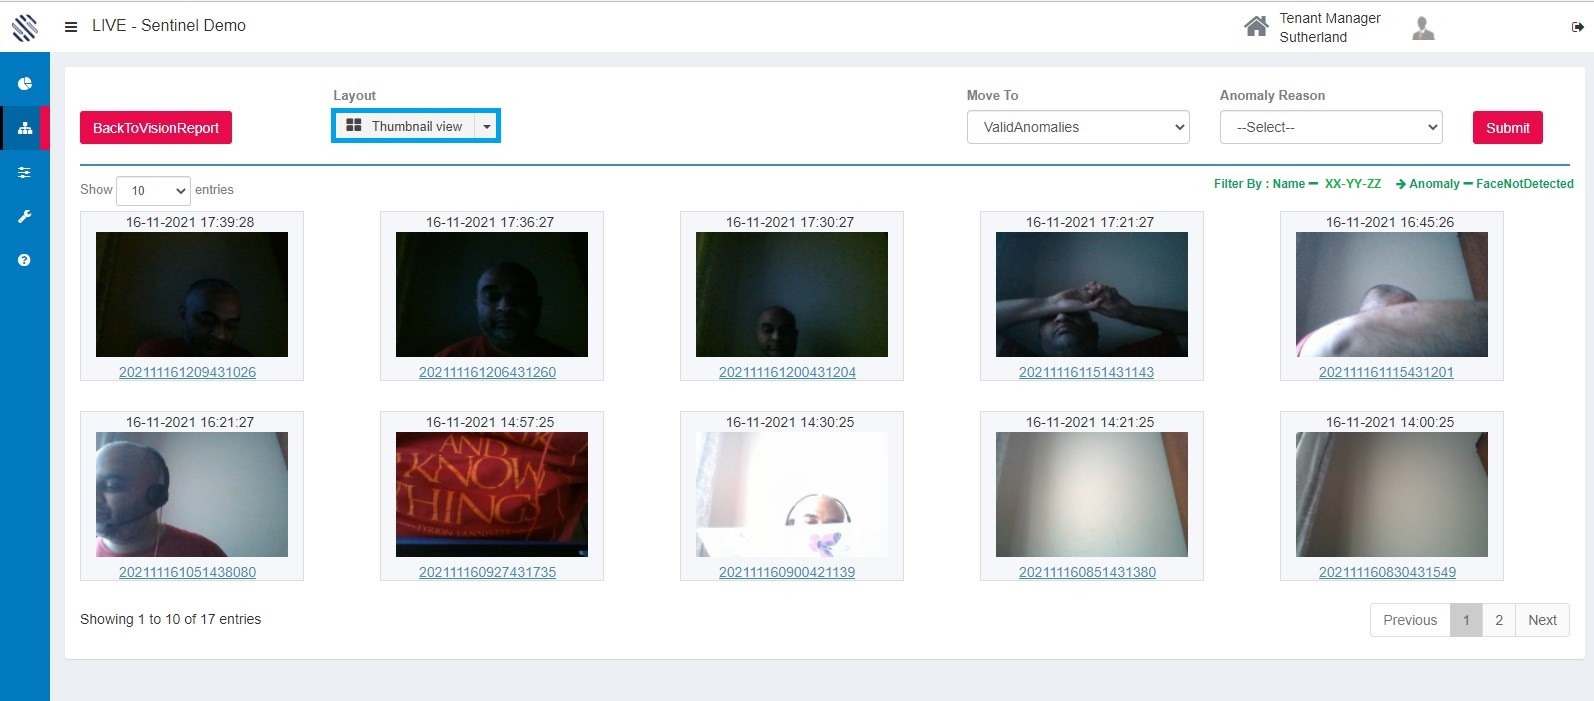
Figure 48
Select any anomaly from the grid. Now, click on the Anomaly reason drop down box to list out the reason for the selected image and select submit.
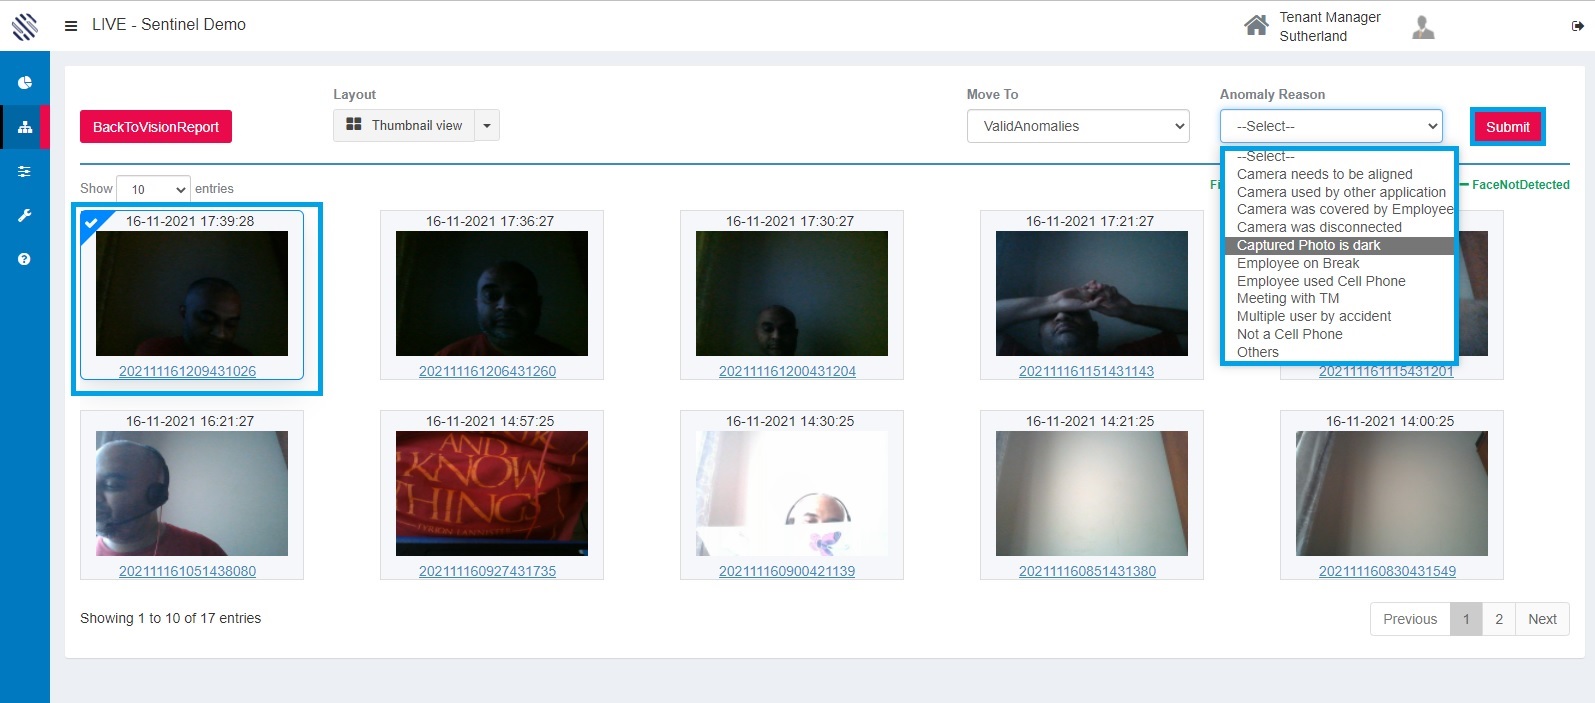
Figure 49
Once the user submitted the anomaly reason, the image will be removed from the grid.
Detailed view: It displays the anomalies with detailed information in the grid. The number of records can be viewed as per the number entered in the show entries box.
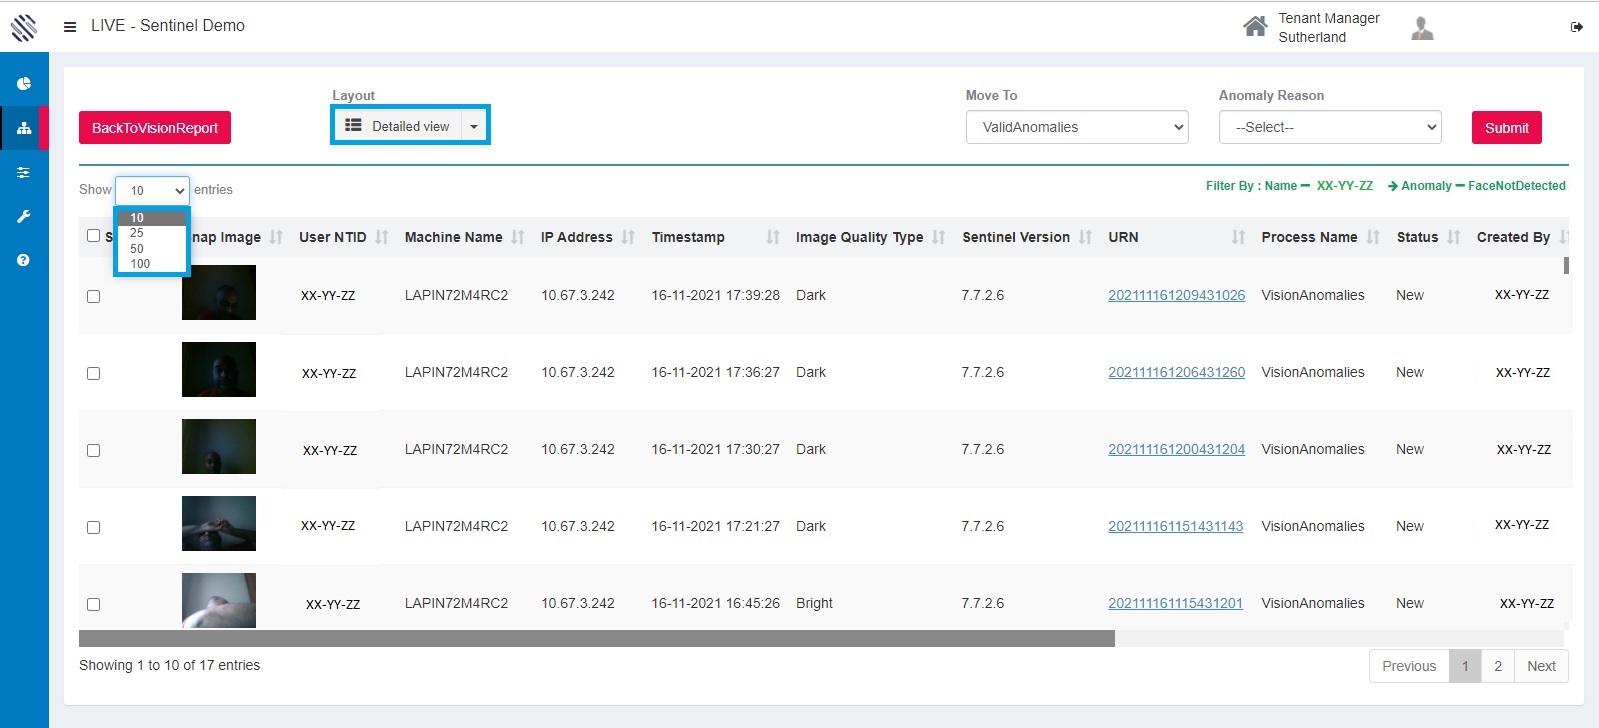
Figure 50
The user can click on check box near to the image and can submit by selecting their anomaly reason.
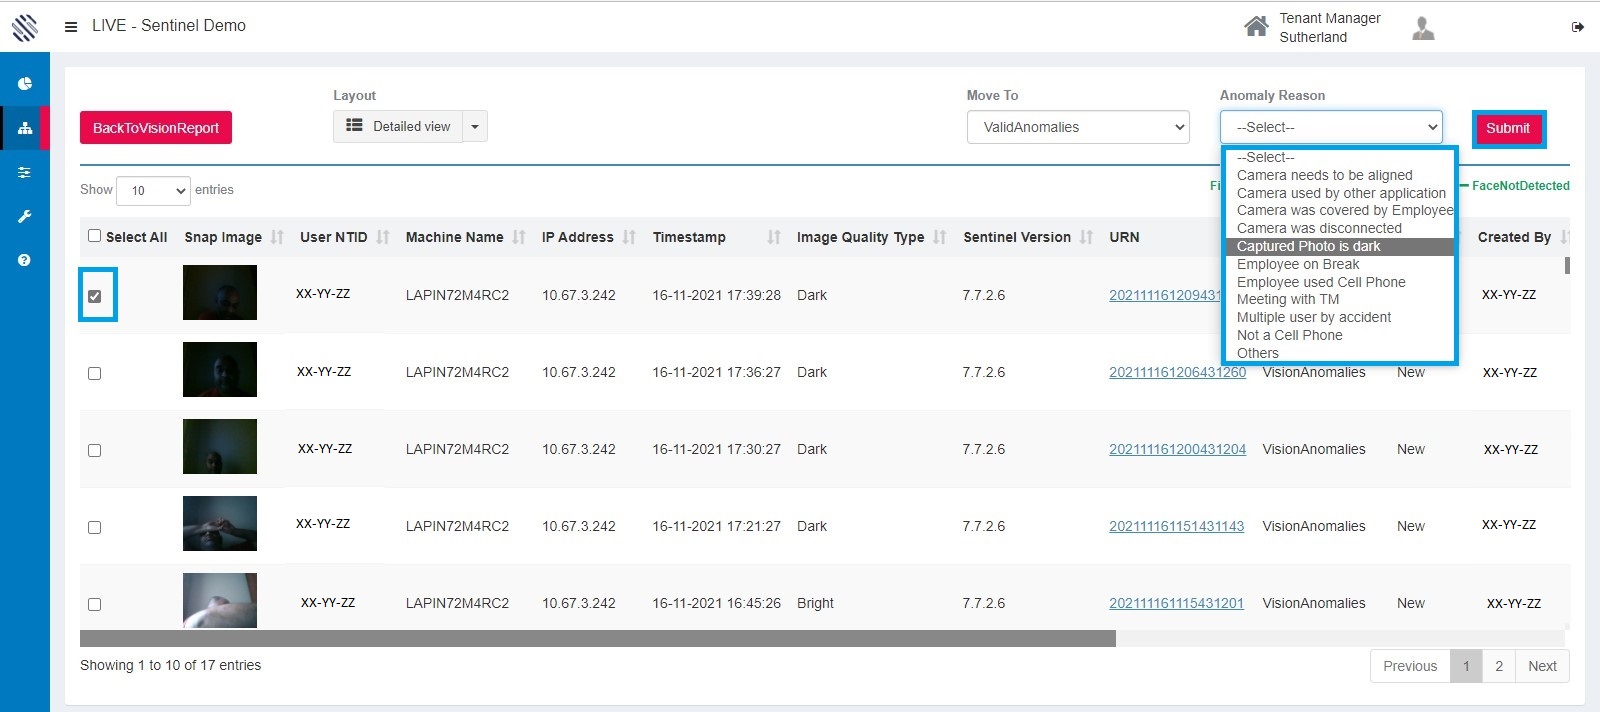
Figure 51
The user can click on the ""Select All" box to analyze the image or they can also select the URN hyperlink to analyze the image.
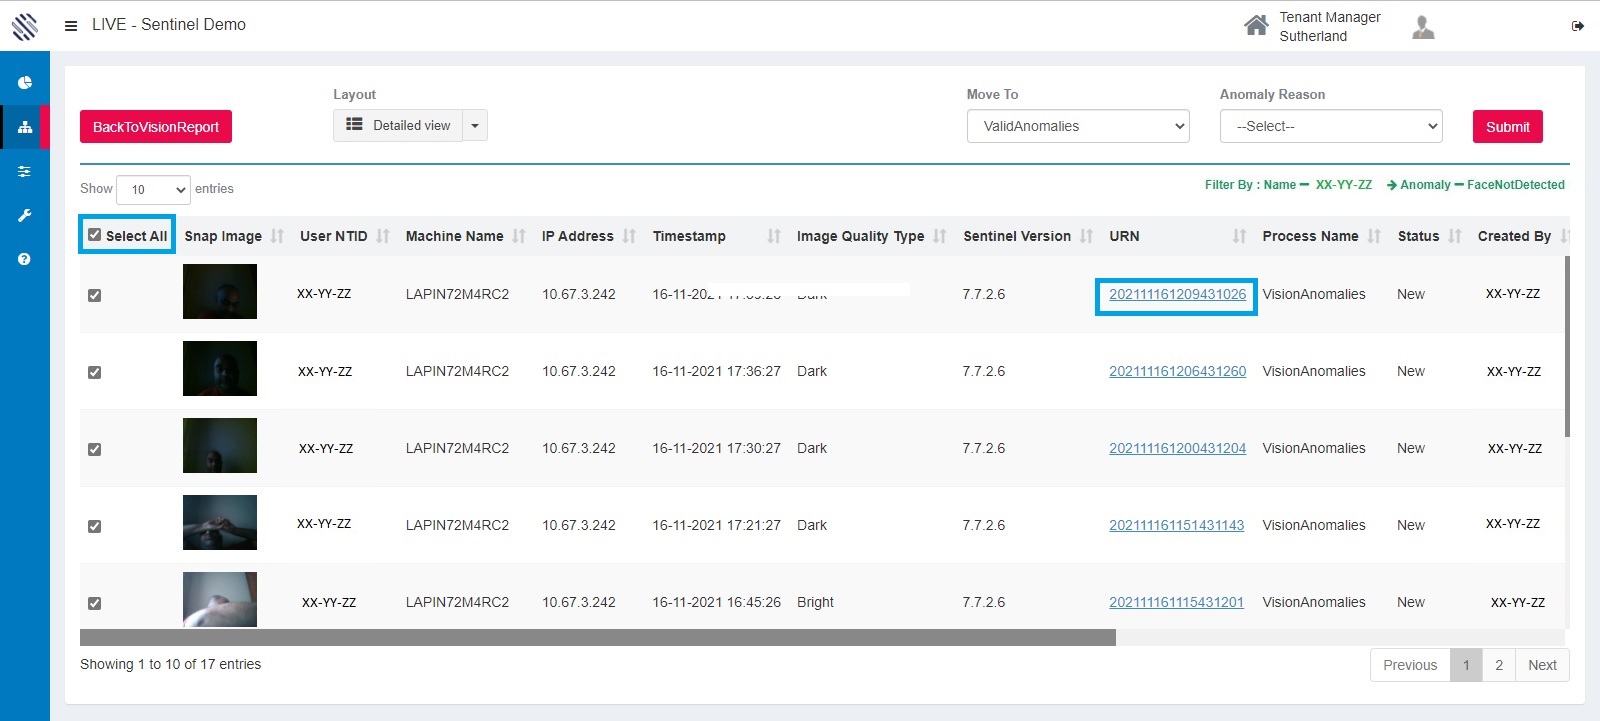
Figure 52
After analyzing the image, the user can give their reason and submit.
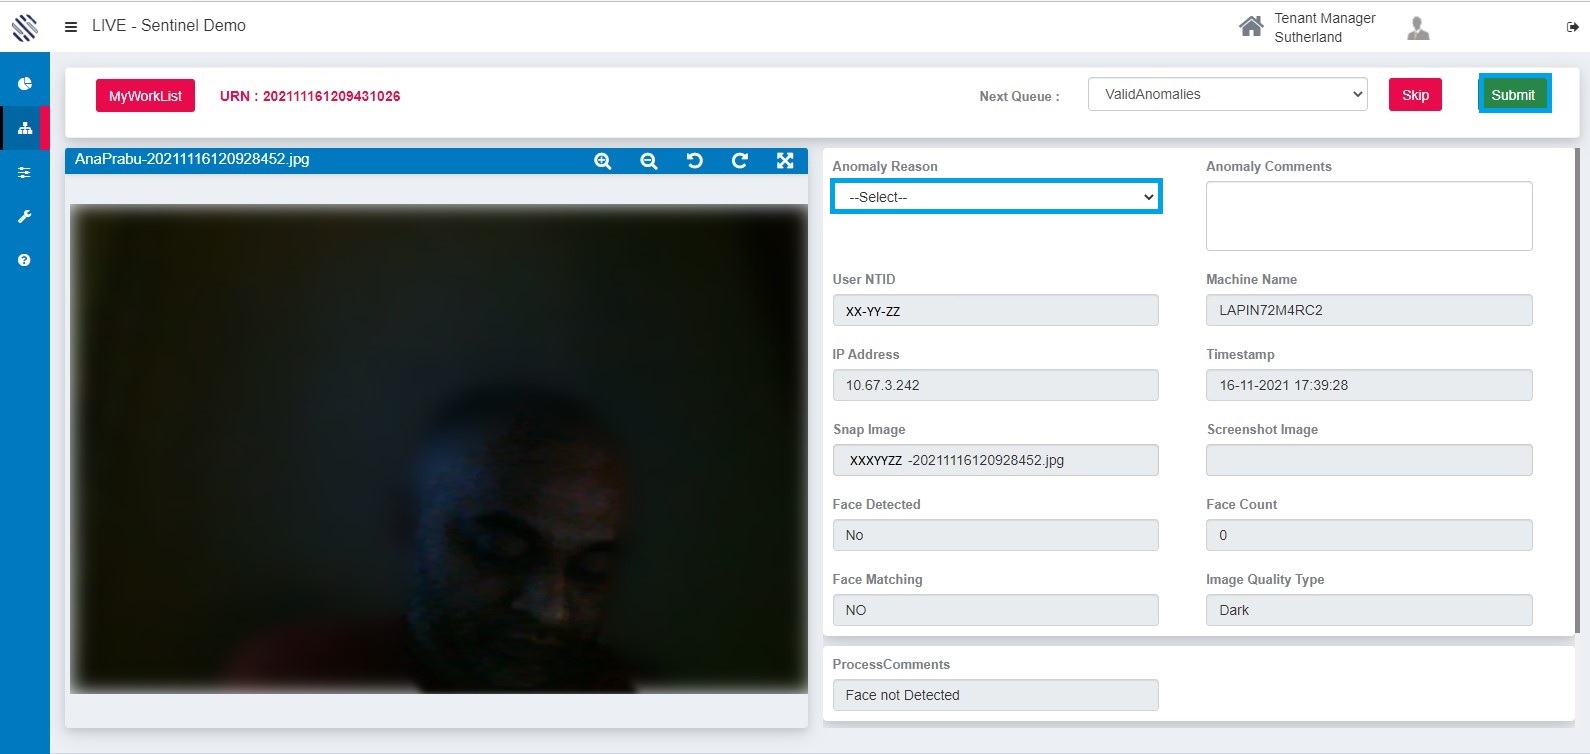
Figure 53
Normal view: The Normal view represents the anomalies in the grid with details. The user have to select the URN and analyze it.
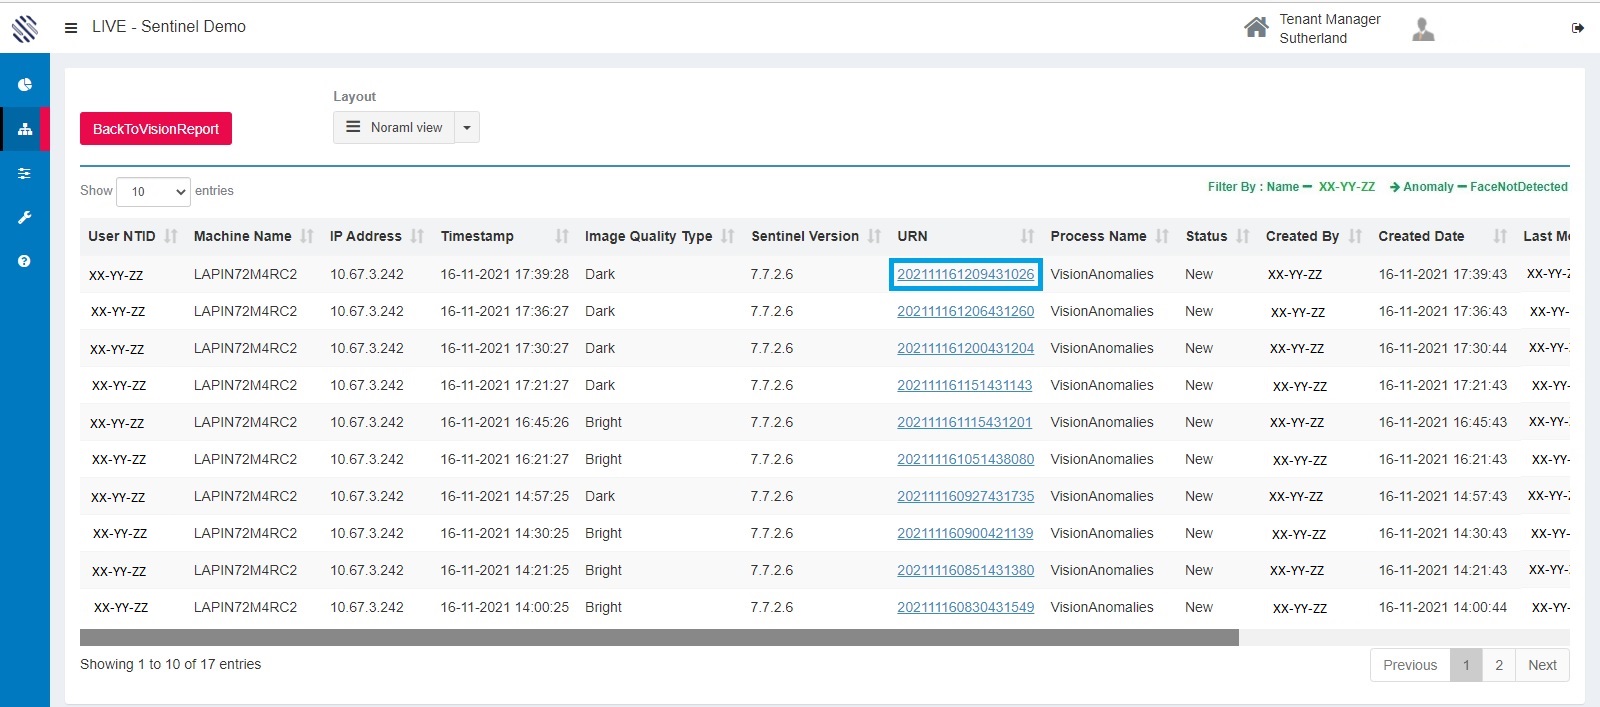
Figure 54
After analyzing the image, the user can give their reason and submit. The user can also classify the anomaly as valid or invalid anomalies from the next queue drop down.
Selecting the skip button goes to the next anomaly or you can submit it.
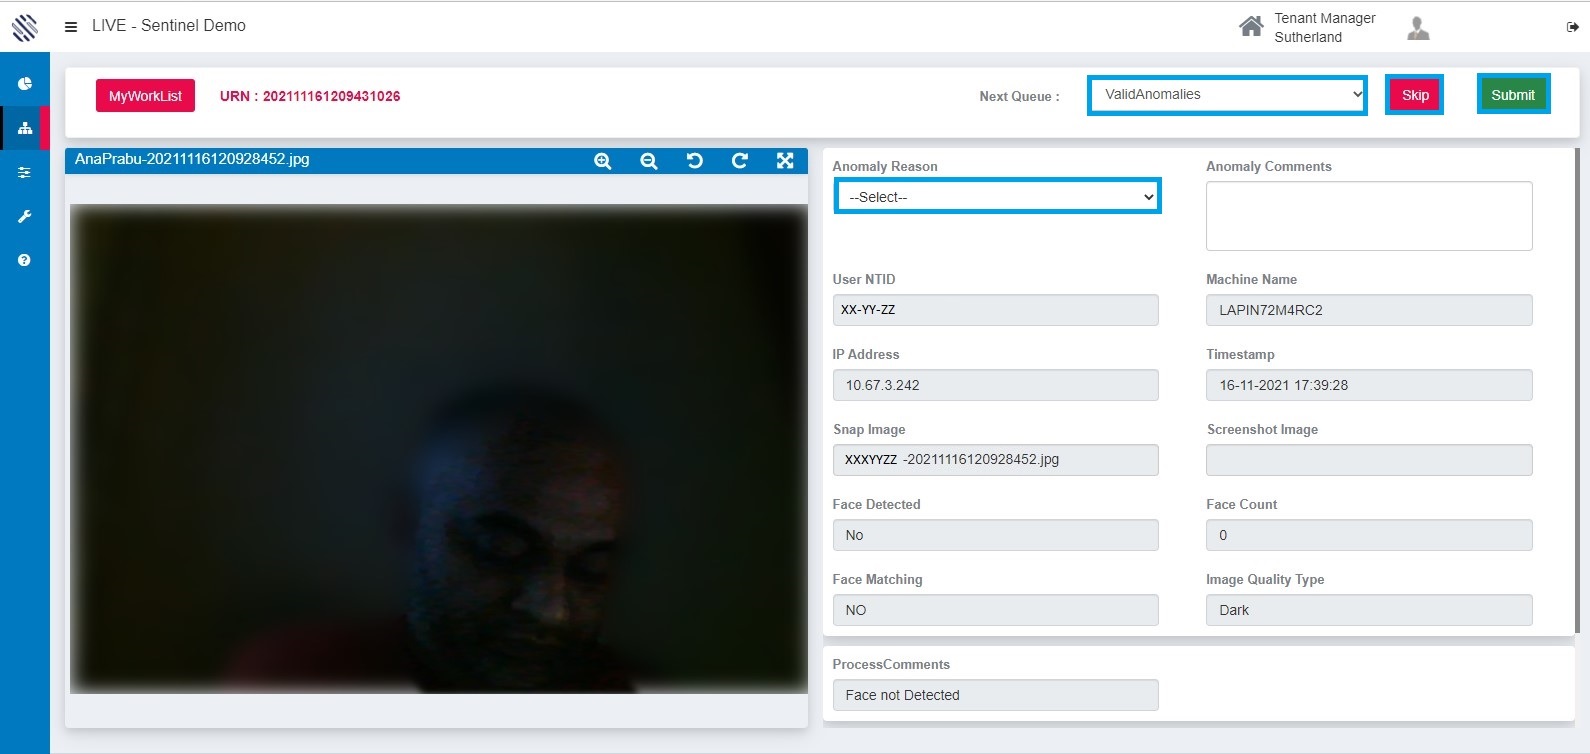
Figure 55
Report Calculation:
Total Photos Received = Total Photos actually received divided by the estimated photos gives the total photos received percentage.
Total estimated photos = Total photo captured by Estimated time.
Photos not Received = Total “Camera Not Available” anomalies for team members scheduled to work divided by total estimated photos for the team.
Face not Detected = Total of “Face not Detected” anomalies for the team members scheduled to work divided by total photos actually received.
Face not Matching = Total of “Face not Matching” anomalies for the team members scheduled to work divided by total photos actually received.
More then one Face = Total of “More than one Face” anomalies for team members scheduled to work divided by total photos actually received.
Cell phone detected = Total of “Cell phone detected” anomalies for team members scheduled to work divided by Total photos actually received.