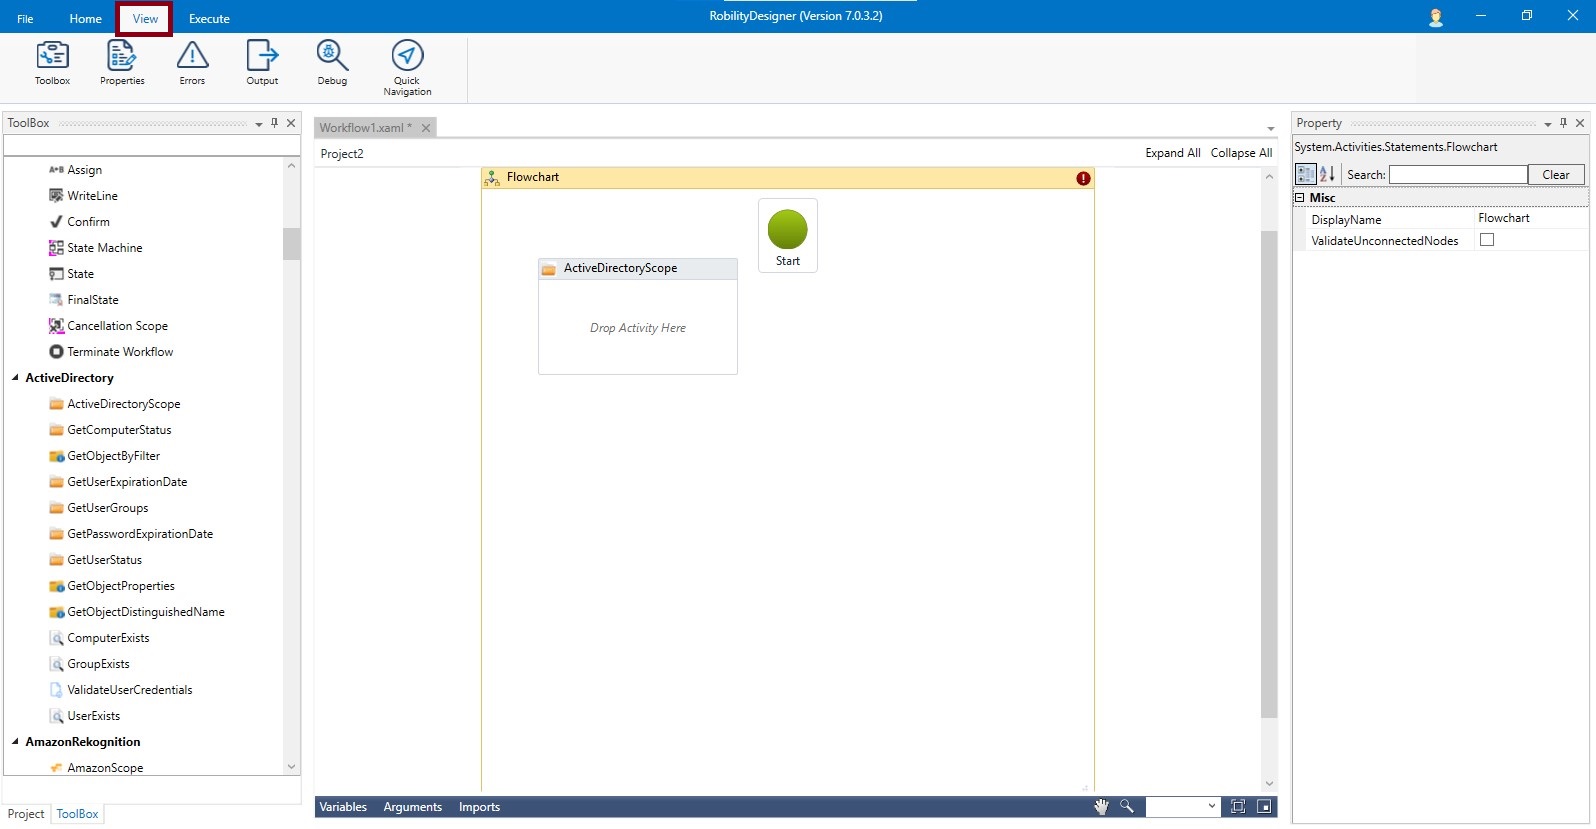
The view tab provides access to the Toolbox, Properties, Error, Output, Debug, Quick navigation menus. A detailed walk-through follows.
Figure 1
Toolbox
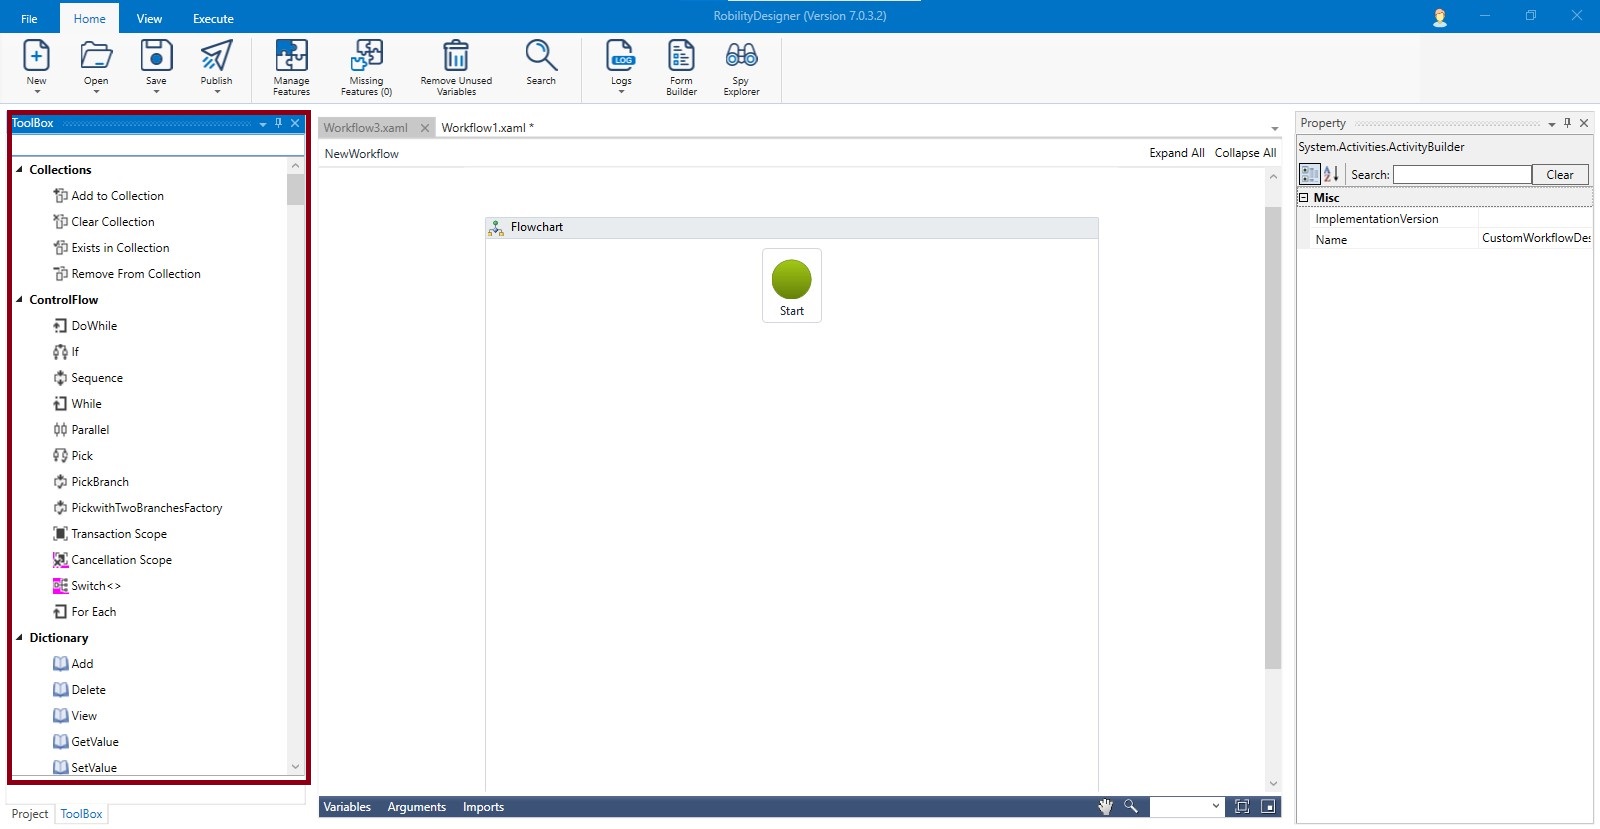
Clicking on this menu will list down the activities under the toolbox pane. There are 150 plus activities that the user can avail to create robust robots. These are drag and drop activities and minimal programming skills are required to use these simple yet proficient activities. Vertical scroll bars can be used for easy navigation.
Figure 2
Properties
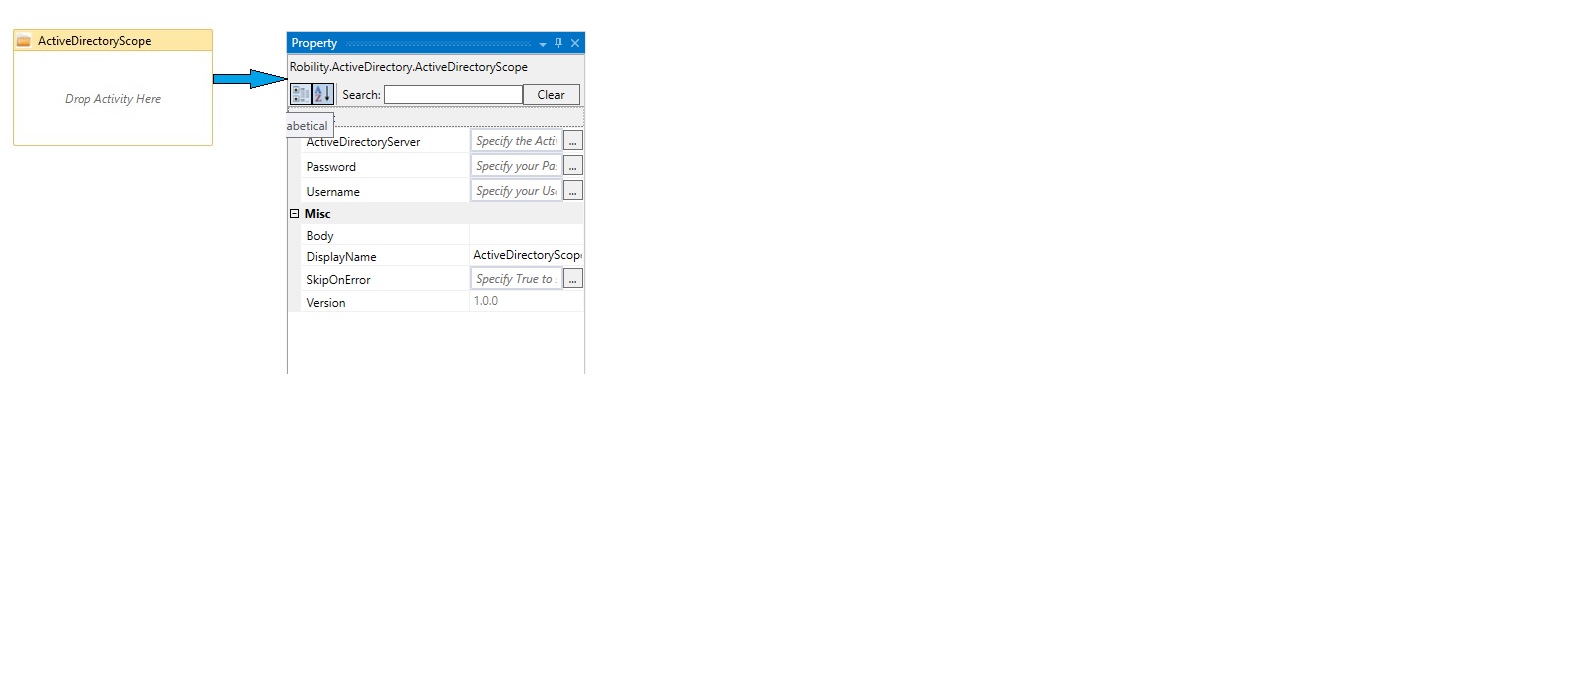
Each activity has a different set of property for its execution. You should fill in details accordingly to execute the activity. Display name will be auto populated, and you can change it.
Figure 3
Figure 4
This menu will display the errors window. The errors will be displayed while developing and functioning in the workflow below to the workflow in the designer.
Figure 5
Figure 6
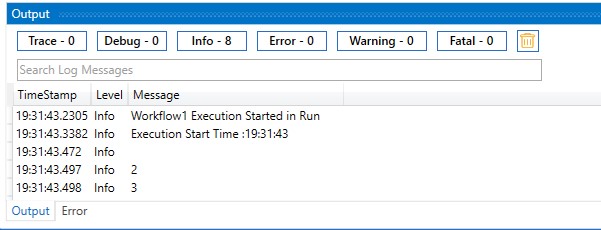
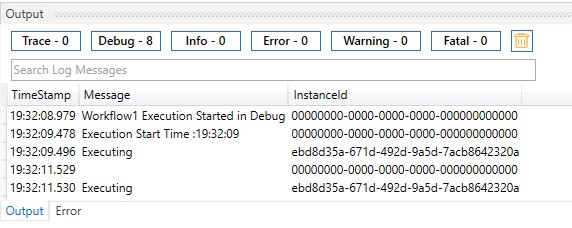
The Output Window displays the footprints of the workflow that is executed, based on the log levels that has been chosen by the user.
Figure 7
Figure 8
The Debug window is provided for debugging in order to run the target workflow under controlled conditions that permits you to track its operations in progress and monitor changes that may indicate malfunctioning code.
Figure 9
You can view the debugged results in the Debug window.
Figure 10
The Quick Navigation Window Option
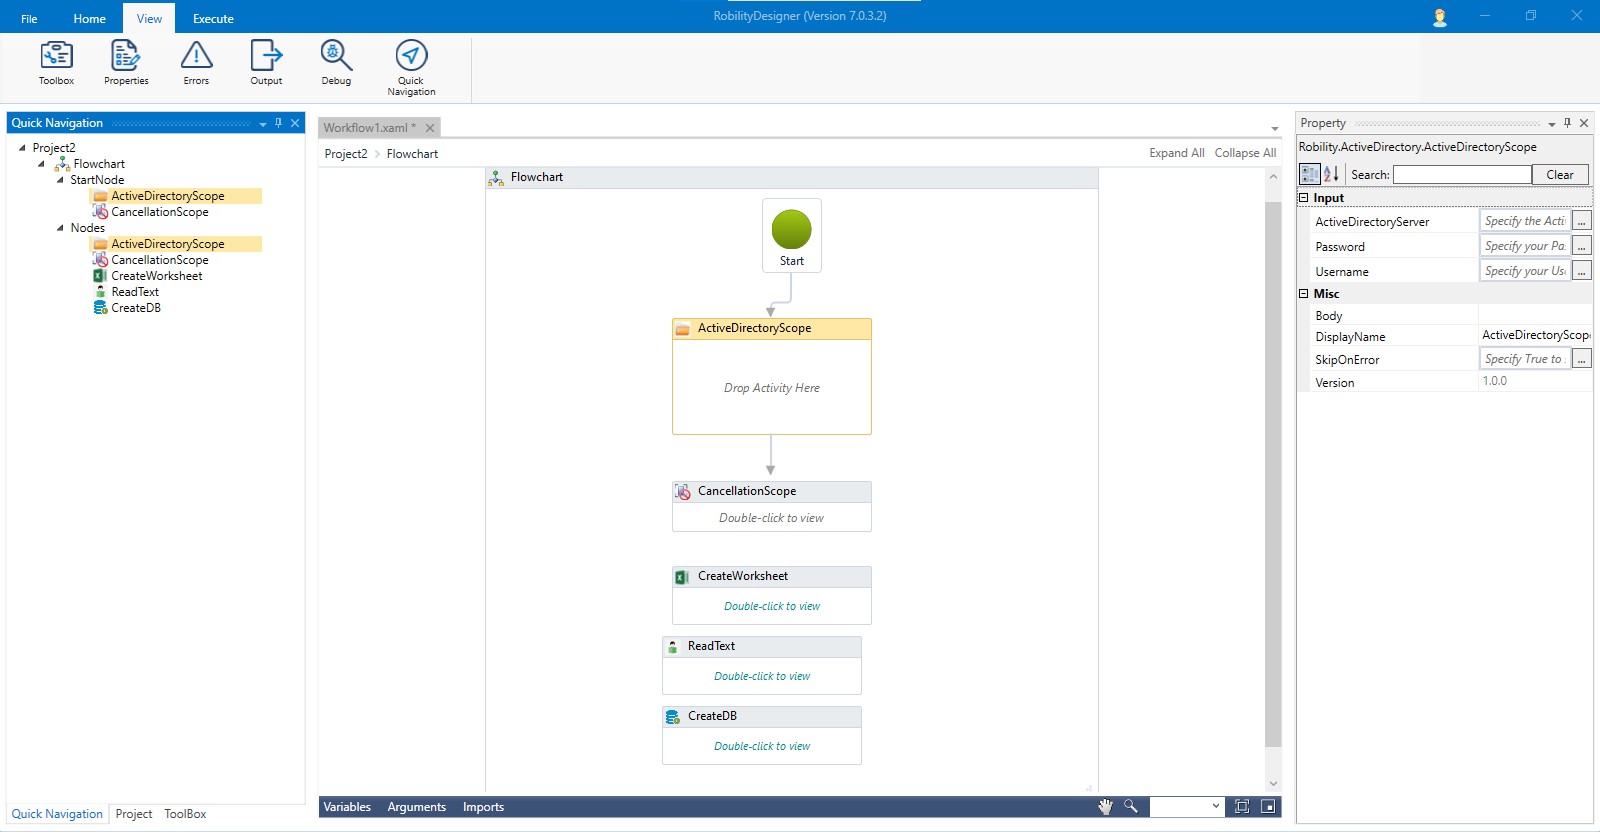
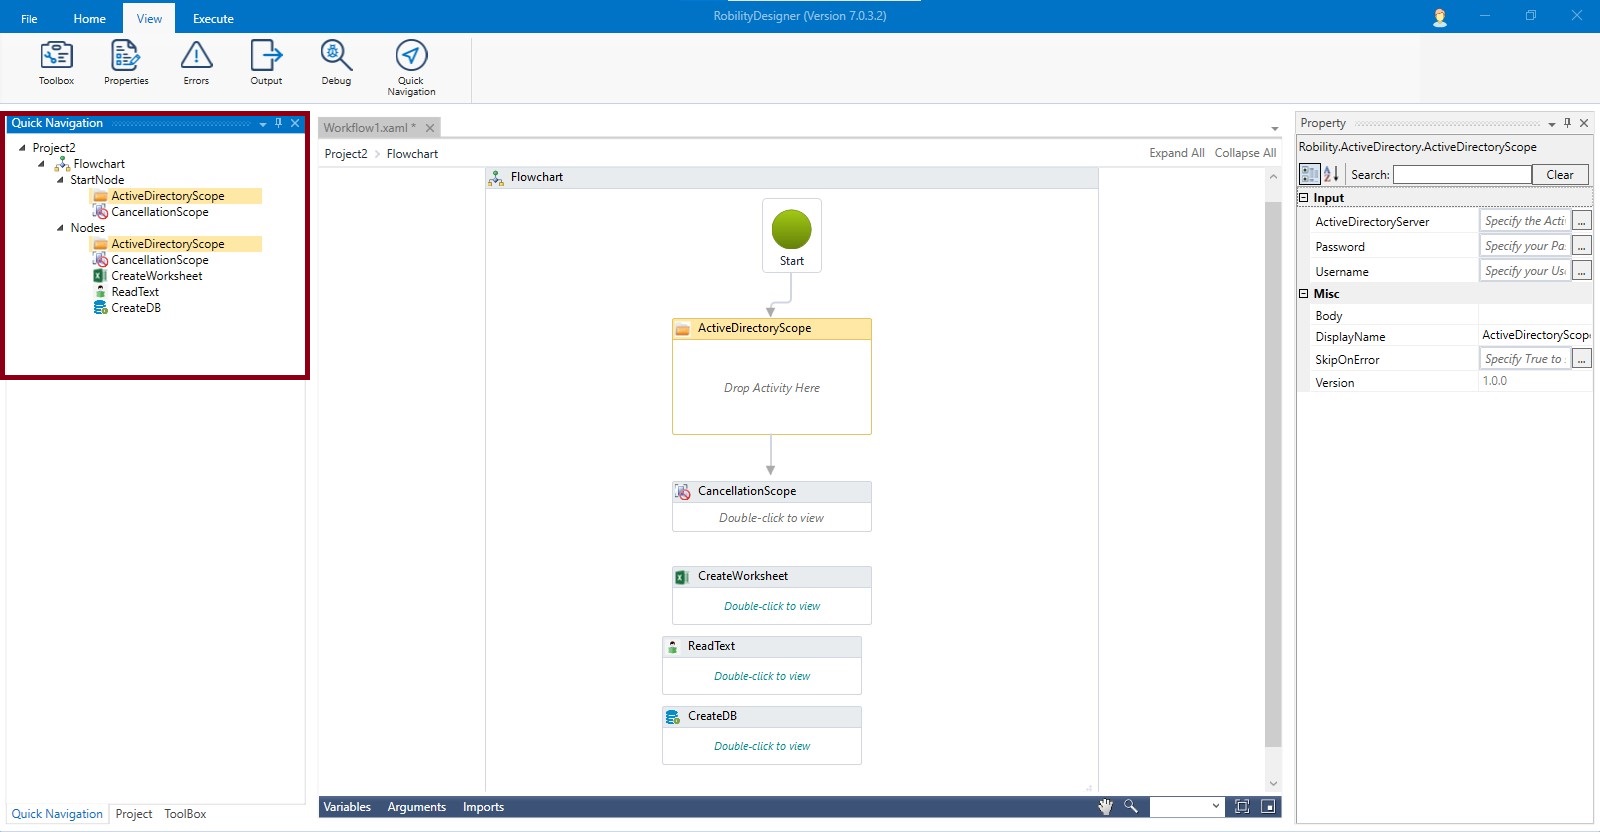
The Quick navigation option facilitates navigating to a specific activity or a part of the workflow, instantaneously.
Figure 11
This is particularly helpful in the event of maneuvering through a complex workflow, since it displays the workflow hierarchy. This helps in easy navigation through multiple steps in the workflow for swift and easy identification of activities. Clicking on the chosen action displays the corresponding activity's properties.
Using the float option, you can get a closer view with similar action.
Figure 13
