The Overall status is a pictorial representation of the Total Transactions and can be viewed using the Dashboard menu in the SmartInteract.
To access the module use the left-hand menu bar.
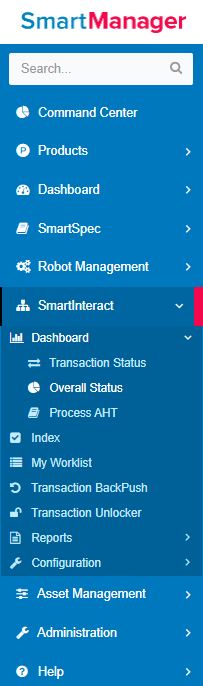
Figure 1
SmartInteract à Dashboard à Overall Status
Use the Switch Project to select the Environment, Tenant and Project. Click on the Overall Status sub-menu.

Figure 2
It displays the selected project's Total transactions in completed, Pending, Exception and Rejected queues, respectively. The Incoming vs. Completed report is displayed as a graph. The Robot Status is projected as a pie chart.
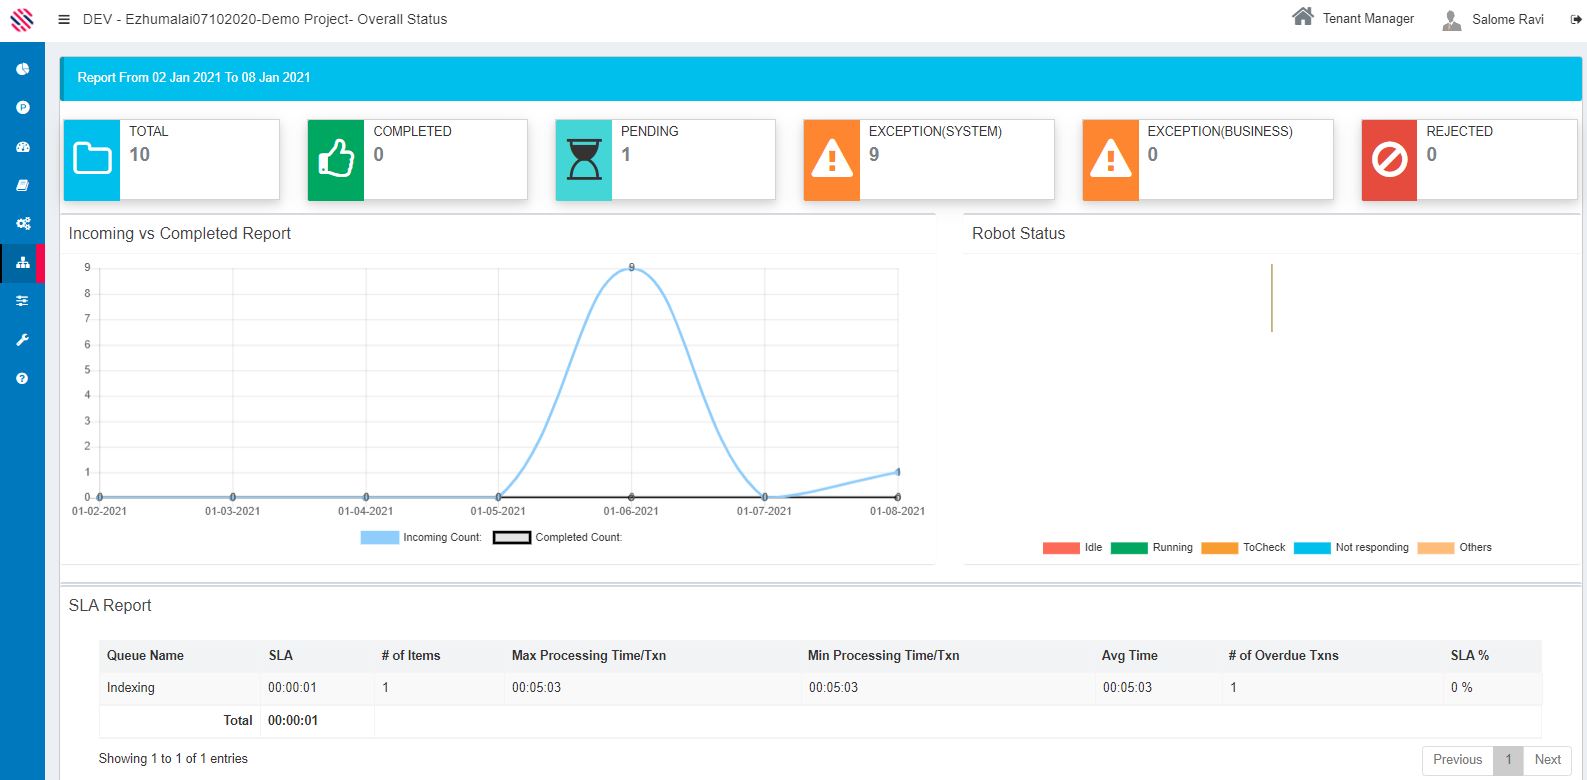
Figure 3
The SLA Report

Figure 3.1
It also comprises the SLA Report ,with details about the, Queue Name, the Defined SLA (In hours, minutes and seconds) Number of items in each queue, The Average Time (processing time divided by number of Items).Maximum and Minimum Processing Time denote the most time taken, and the least time taken for processing a transaction. Number of Items that have crossed SLAs and those that have Achieved SLA are also displayed here, under the respective headers.
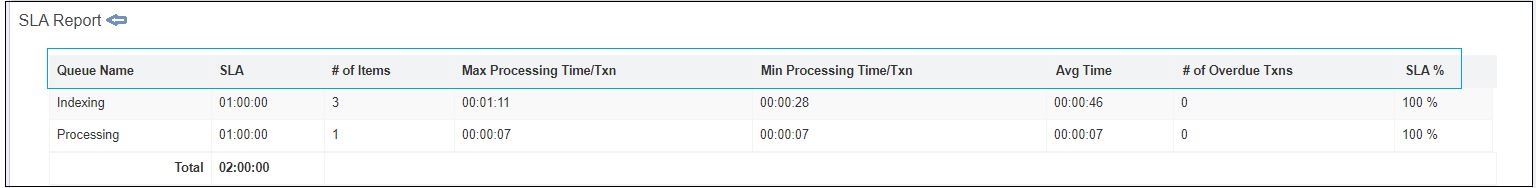
Figure 3.2