This section explains what data can be viewed in the transaction status in SmartInteract Dashboard.
To access the module use the left-hand menu bar.
SmartInteract -->Dashboard --> Transaction Status
Figure 1
SmartInteract’ s Dashboard displays the total number of Transactions uploaded for the various processes in the SmartInteract. It displays the completed transactions as well as pending transactions. In the pending column, one can find details of transactions that are in exception and those that are in fetch data. (which are the commonly configured queues). To sum up, The Transaction Status in the SmartInteract will display all the projects’ and their corresponding processes’ status in a visual representation.
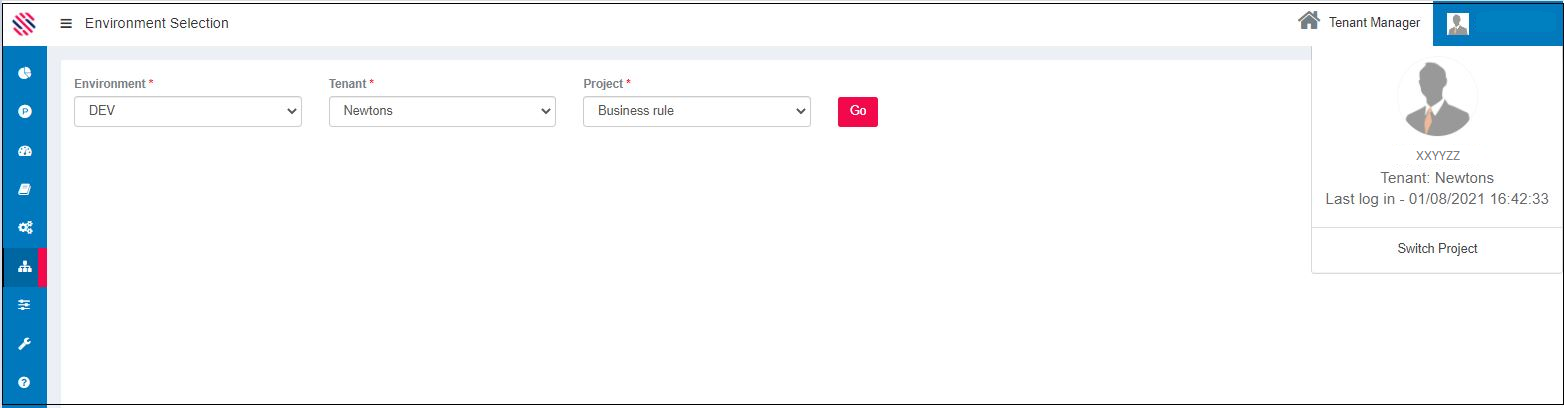
Switch Environment to select the Environment, Tenant and Project. Click on the Transaction Status menu. Select the from and to dates and click on the Go button.
(1)The Transaction Count will be displayed on the left. (2) The Queue Type is at the bottom and the Transaction Status will be projected.(3) Once every 5 minutes the page will be Auto Refreshed. The Total Count of transaction of the selected project for the selected timeline will be displayed. Similarly, Transaction count in different statuses, such as Pending, Completed, Business, System Exception, and Rejected will be displayed visually.
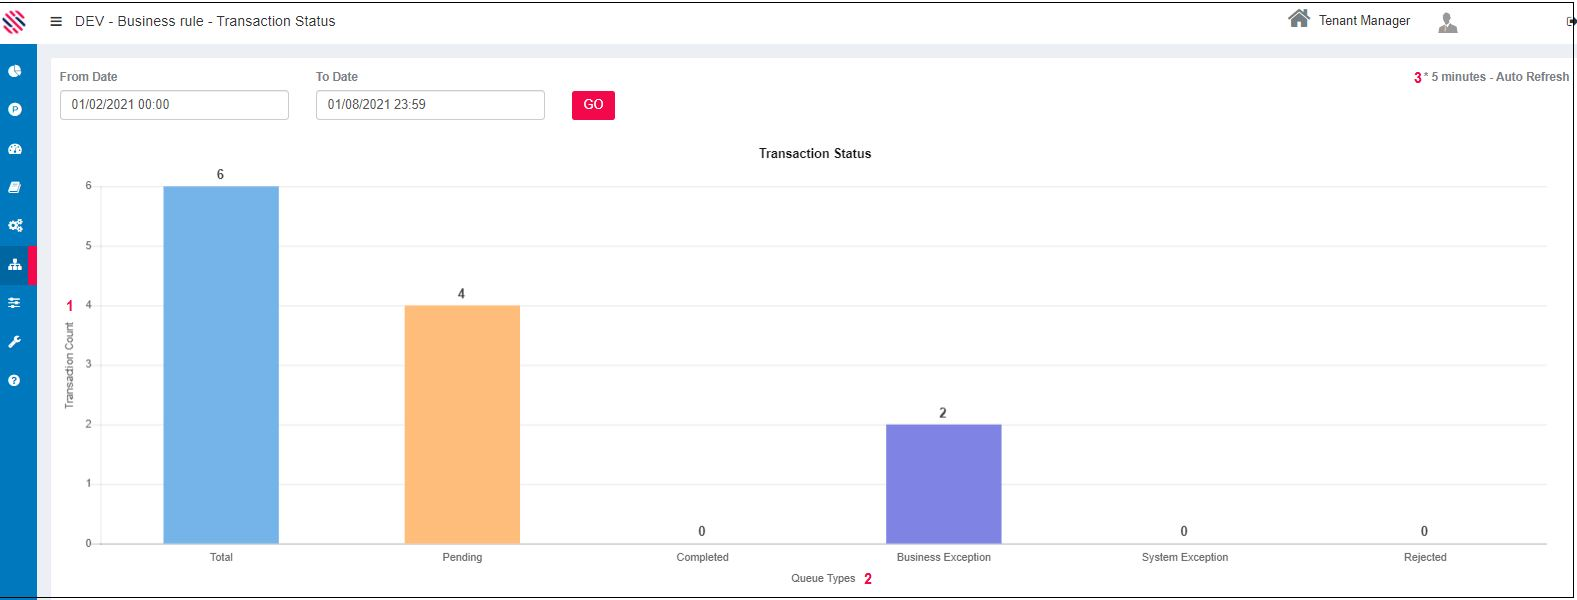
Figure 2
Hovering over each column will display the count of the same.
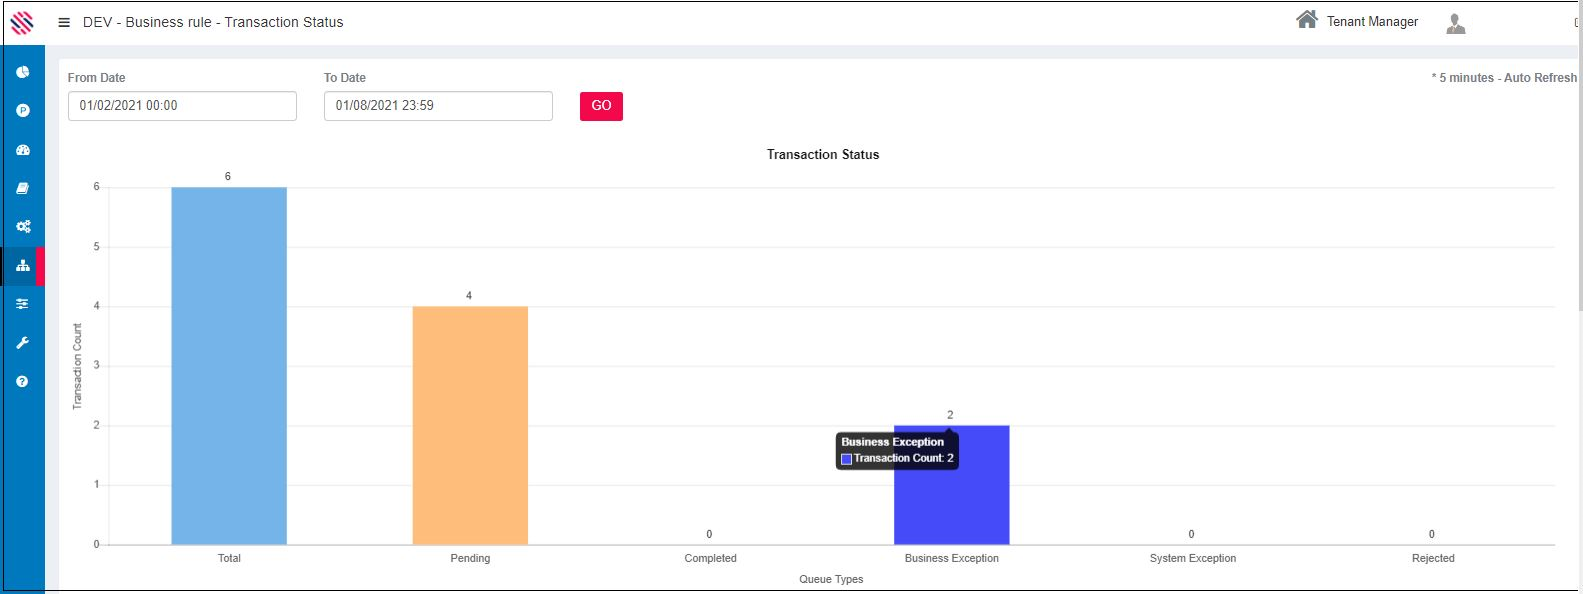
Figure 3
Clicking on each will display only the selection.
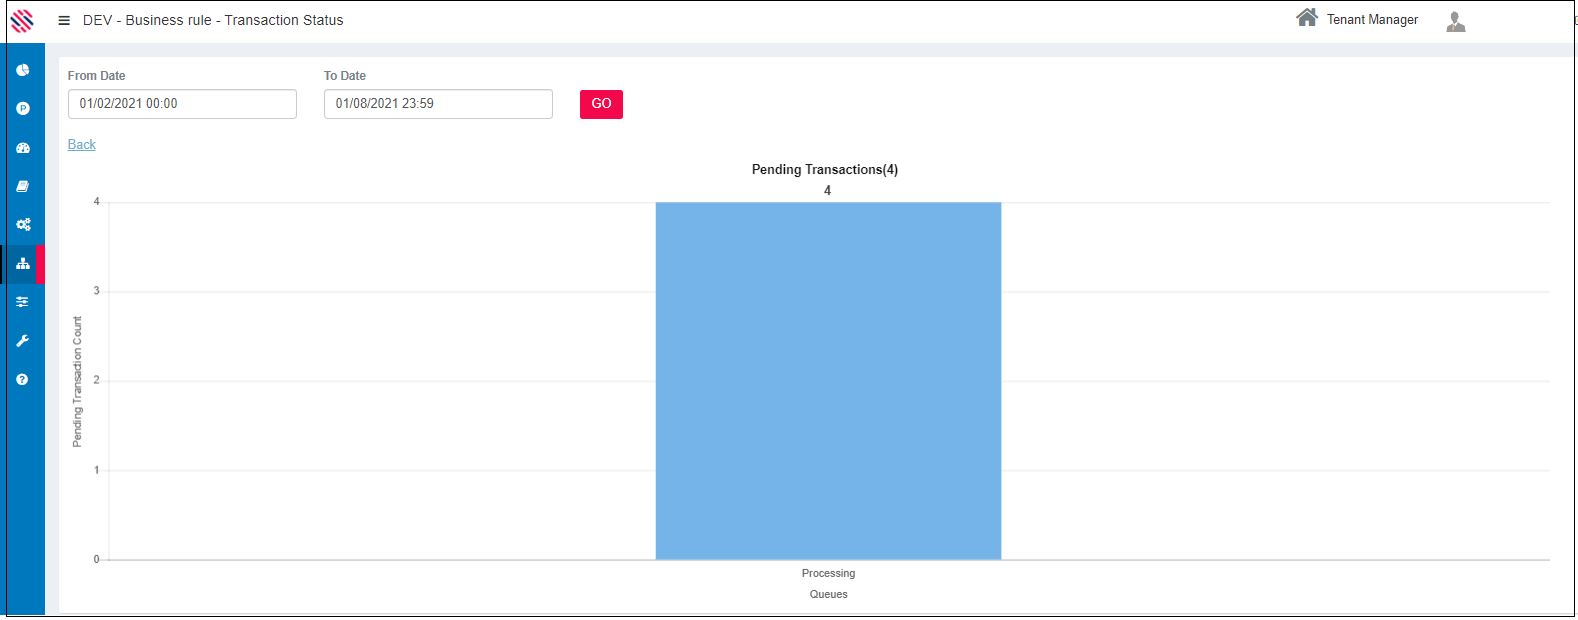
Figure 4
Choosing a different date range will provide different data. However, the selected date range should be equal to or less than 31 days.