
The Vision Report:
Scope of the report
- Monitor and check your teams anomalies.
- To review anomaly images, and take steps to control them
- To ensure business runs in a safe manner.
Accessing the Vision Report:
After making the Tenant selection - Choose the respective project and then select the Anomalies Trends heading.
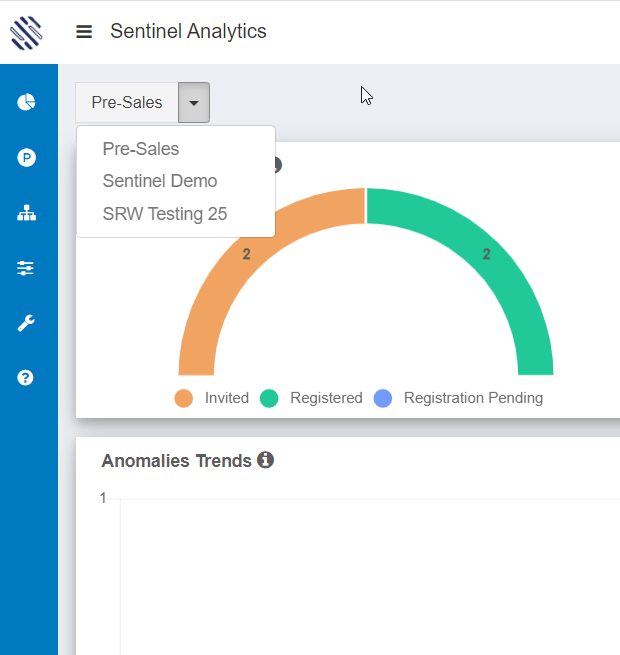
The Vision Report Components:
Team Summary: Consolidated summary of anomalies reported for the team is presented in the first grid. Anomalies captured in the current day is loaded by default.
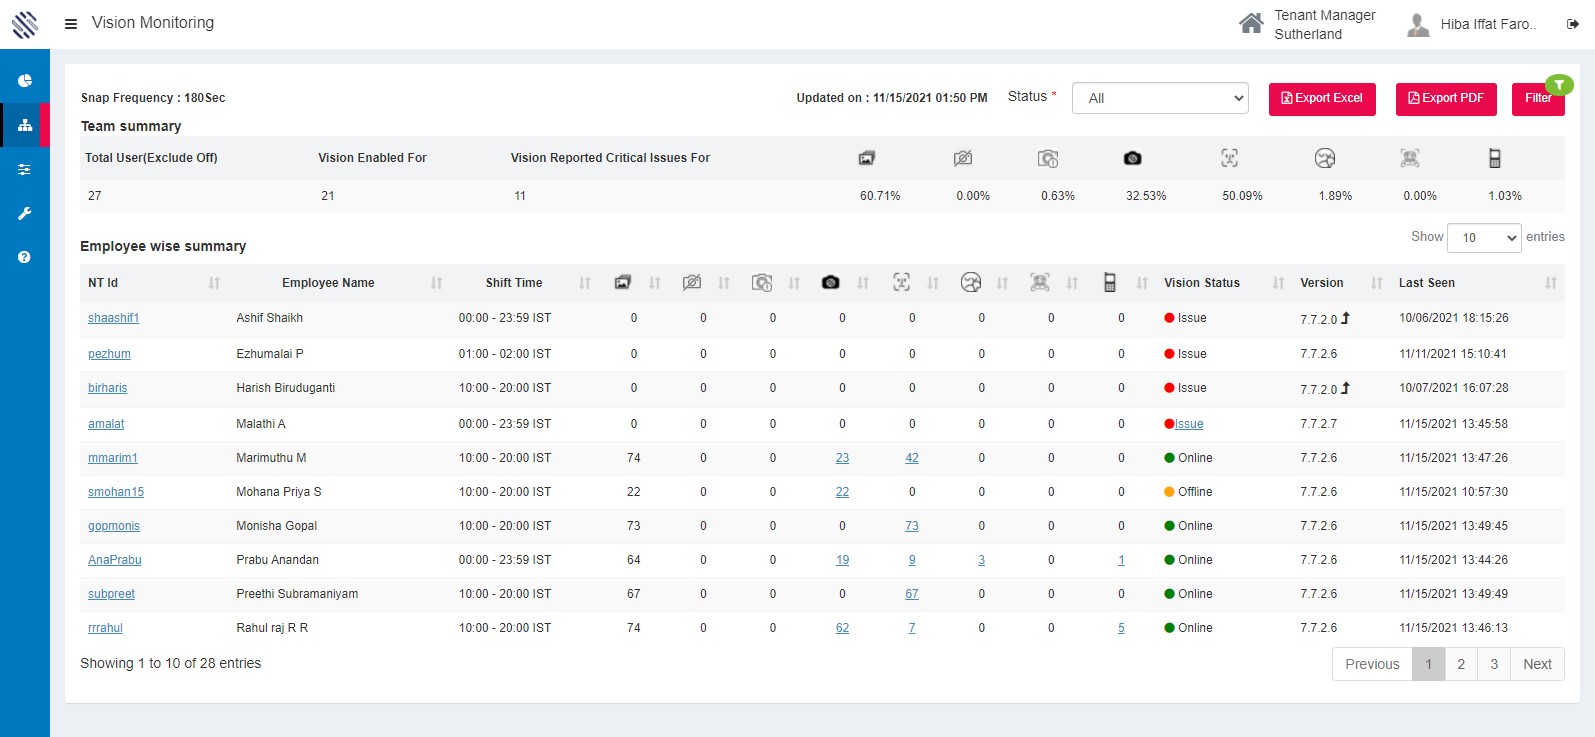
Figure 1
The Sentinel.AI vision snap interval is displayed in the Vision report header.
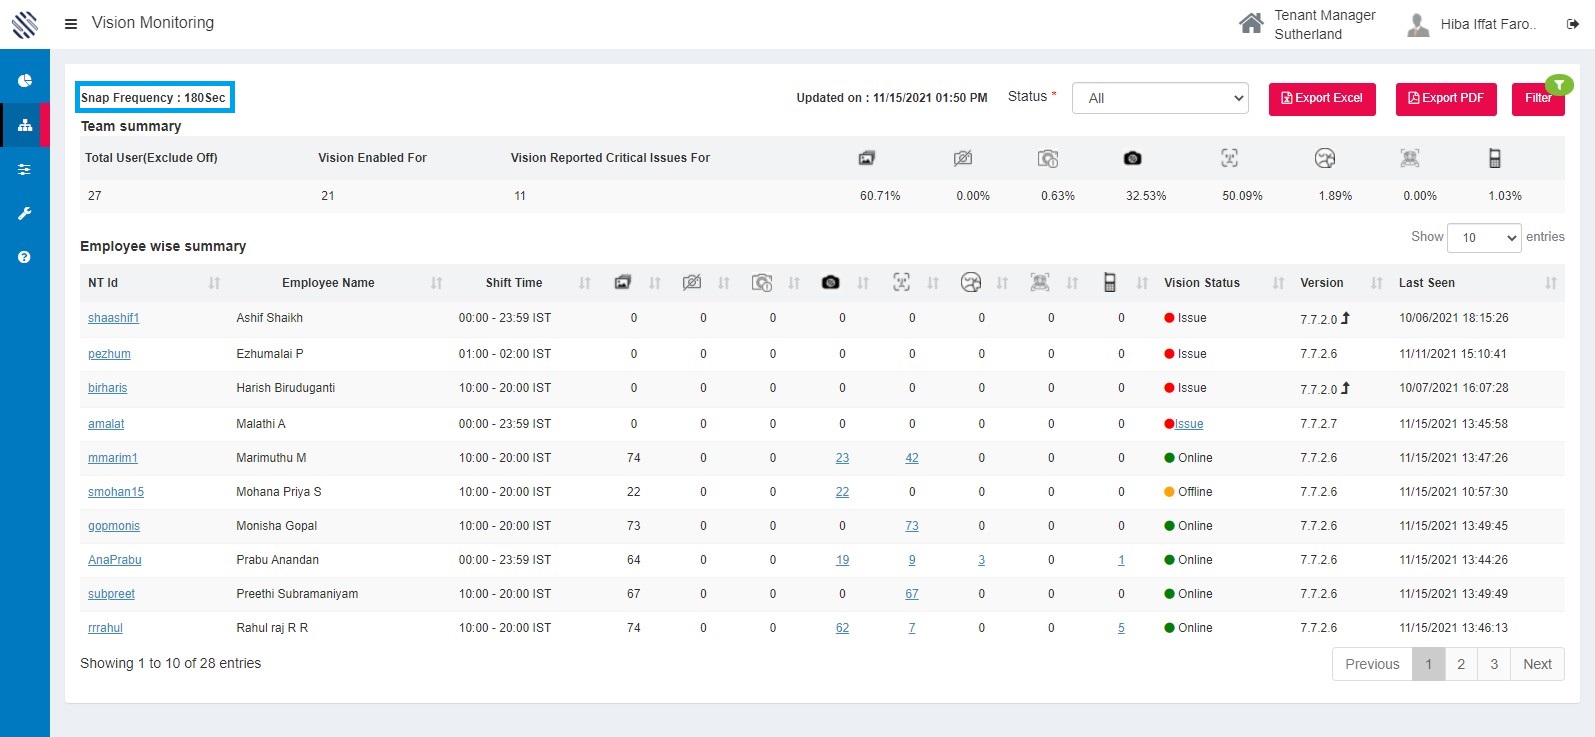
Figure 2
The vision report data will refresh once every 10 minutes.
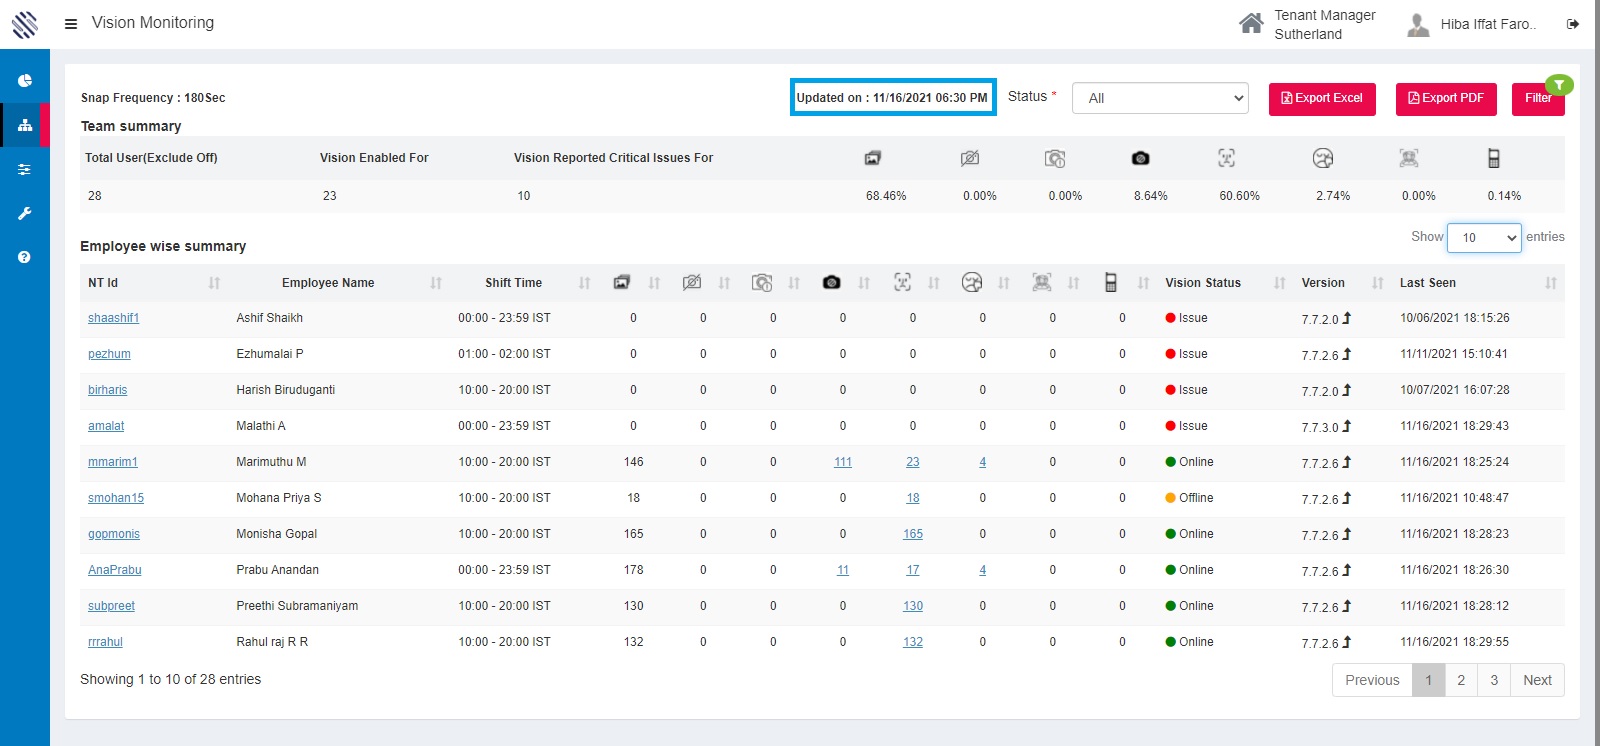
Figure 3
Vision report status explained:
The status drop down depicts the status of every registered user on this platform. It shows whether they are online, offline or pending registration (Signup).
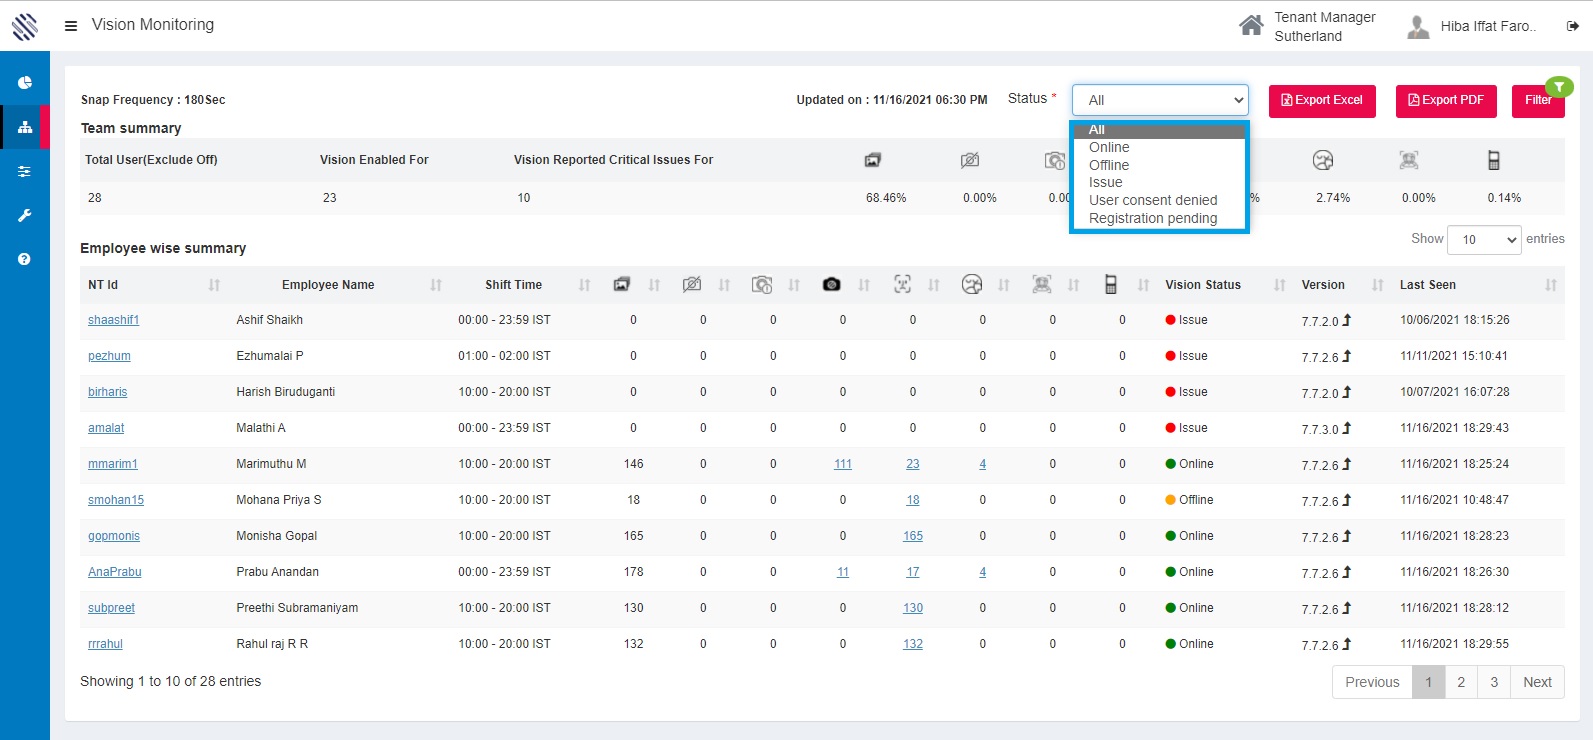
Figure 4
Online: This status indicates that the users have successfully registered to use Sentinel.AI, and the images are coming into the platform as expected.
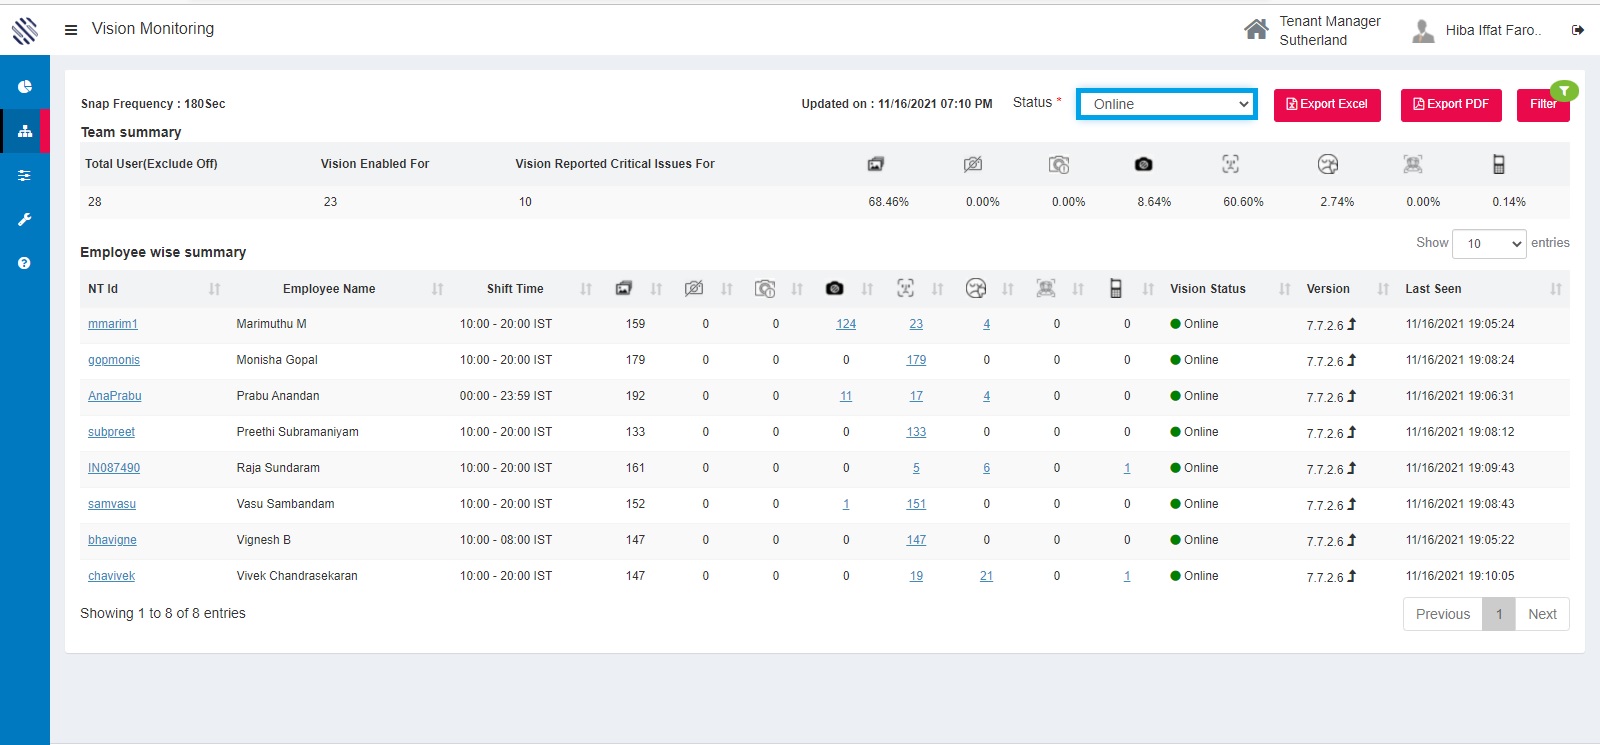
Figure 5
Offline: Users have successfully completed registration but fewer images or no activity detected by the Sentinel.AI platform in the past 10 minutes. Once the user logs in status will change to online.
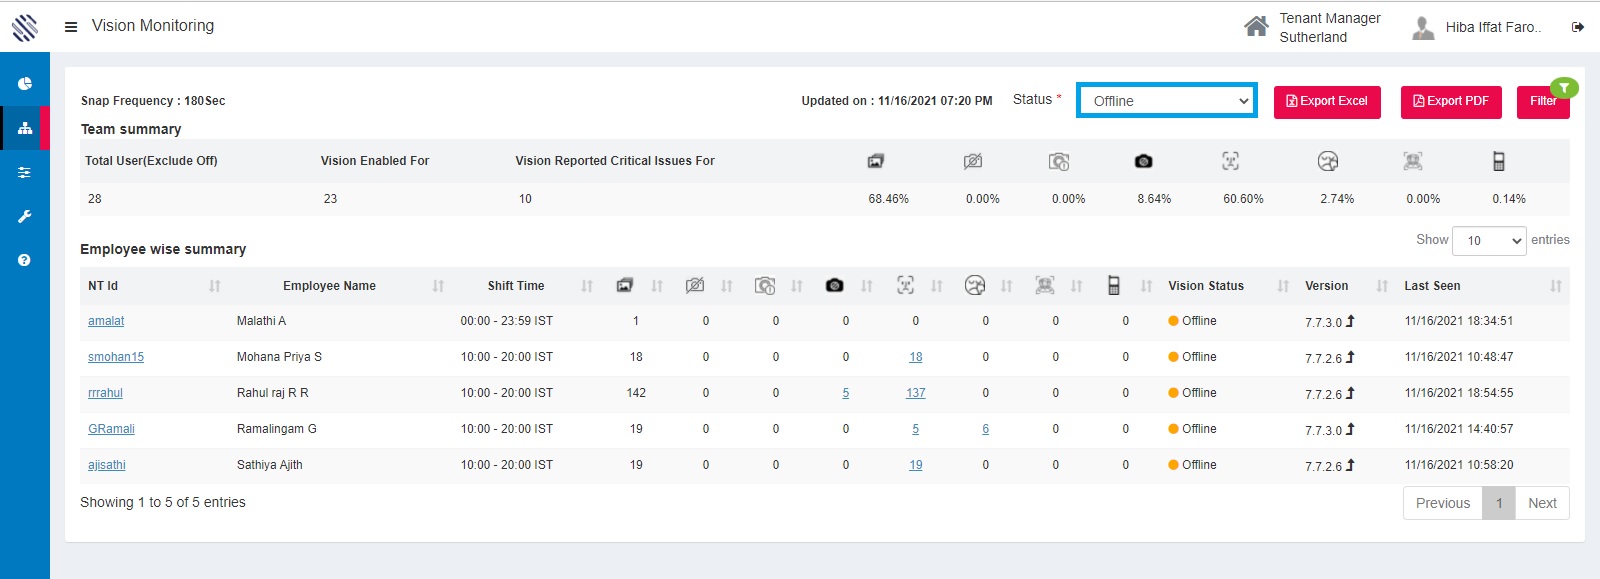 \
\
Figure 6
Issue: This could be caused due to unplanned leave. So, no images have come into the platform during their scheduled shift duration. All application related issues are also tageed with this status.
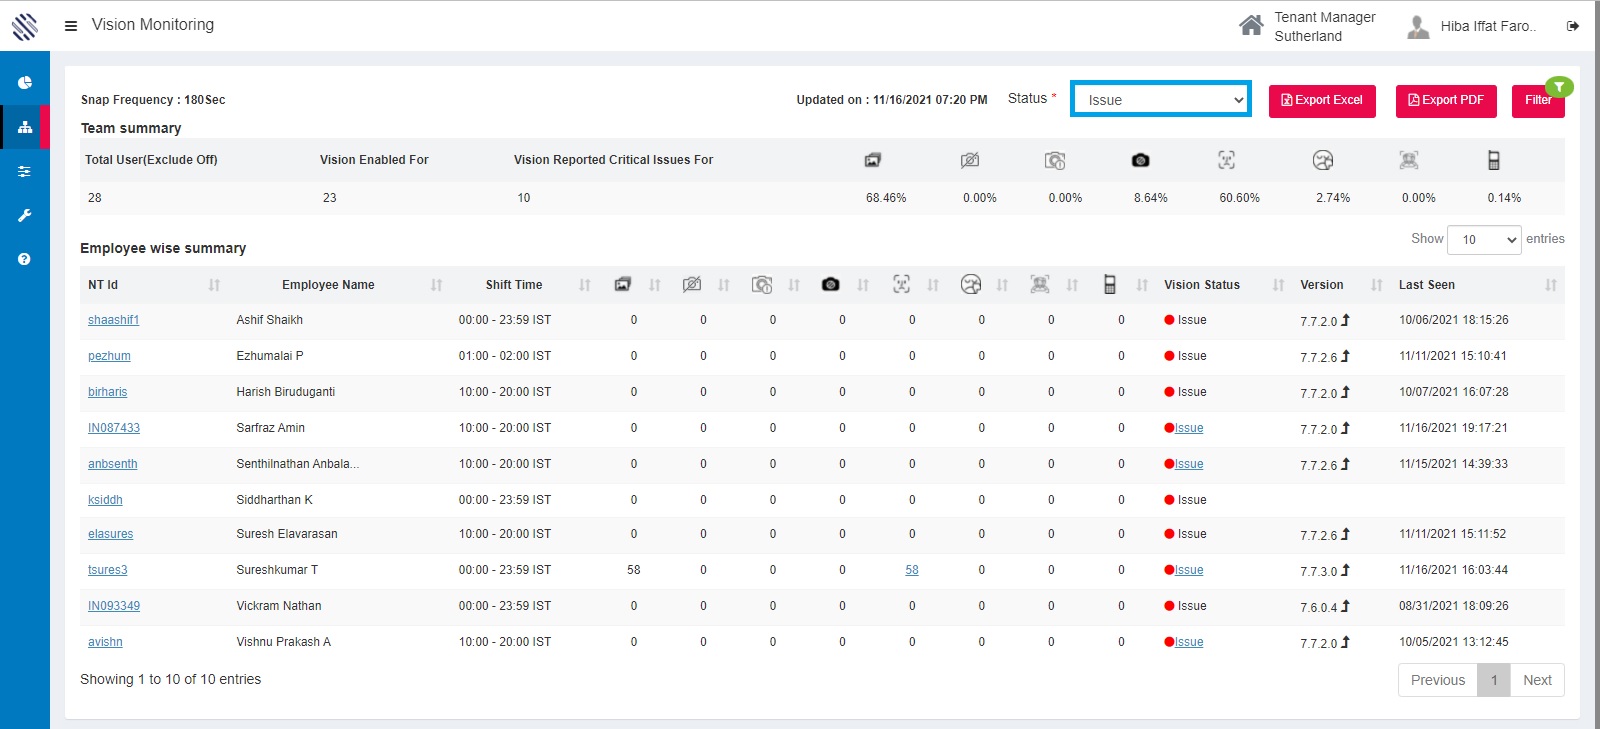
Figure 7
Registration pending: This status is shown for users who have not completed Sentinel.AI Signup.
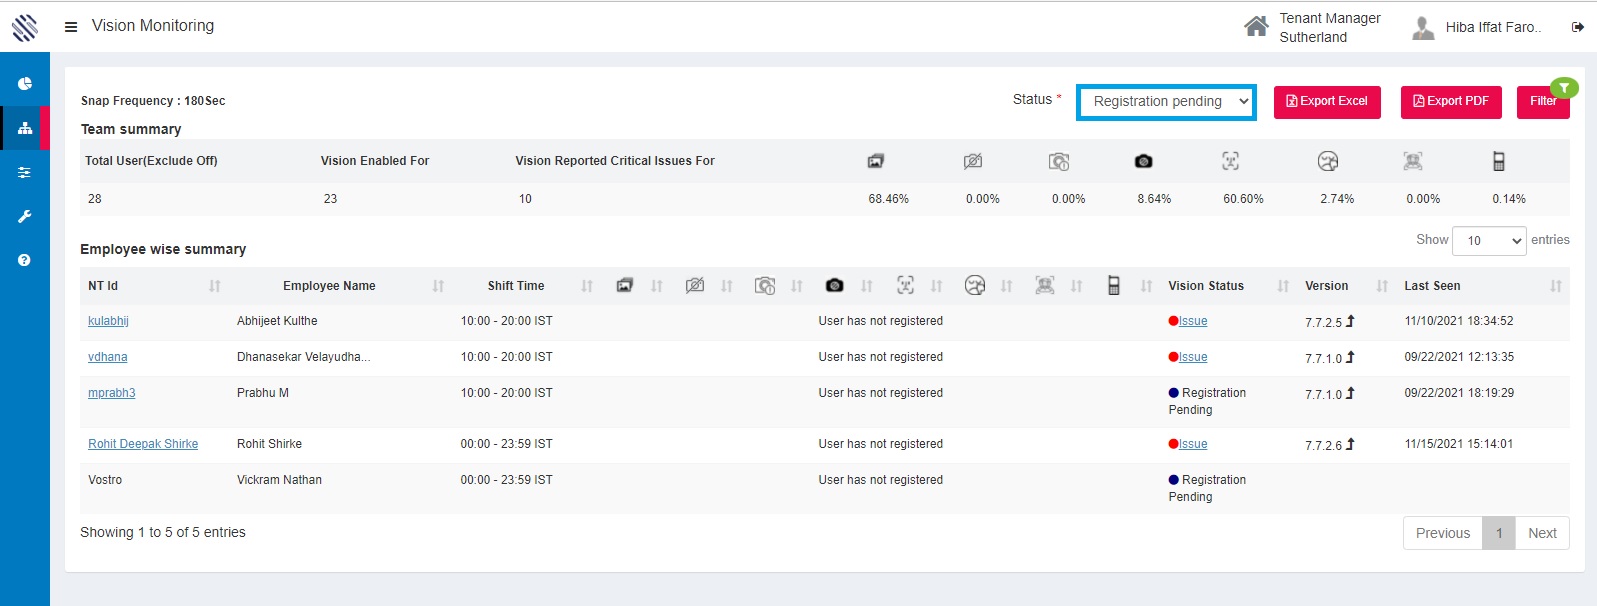
Figure 8
Consent denied: This status is shown for users who have declined to the Sentinel.AI consent form.
Exporting the report:
You can also export the vision report either to excel or a pdf file.
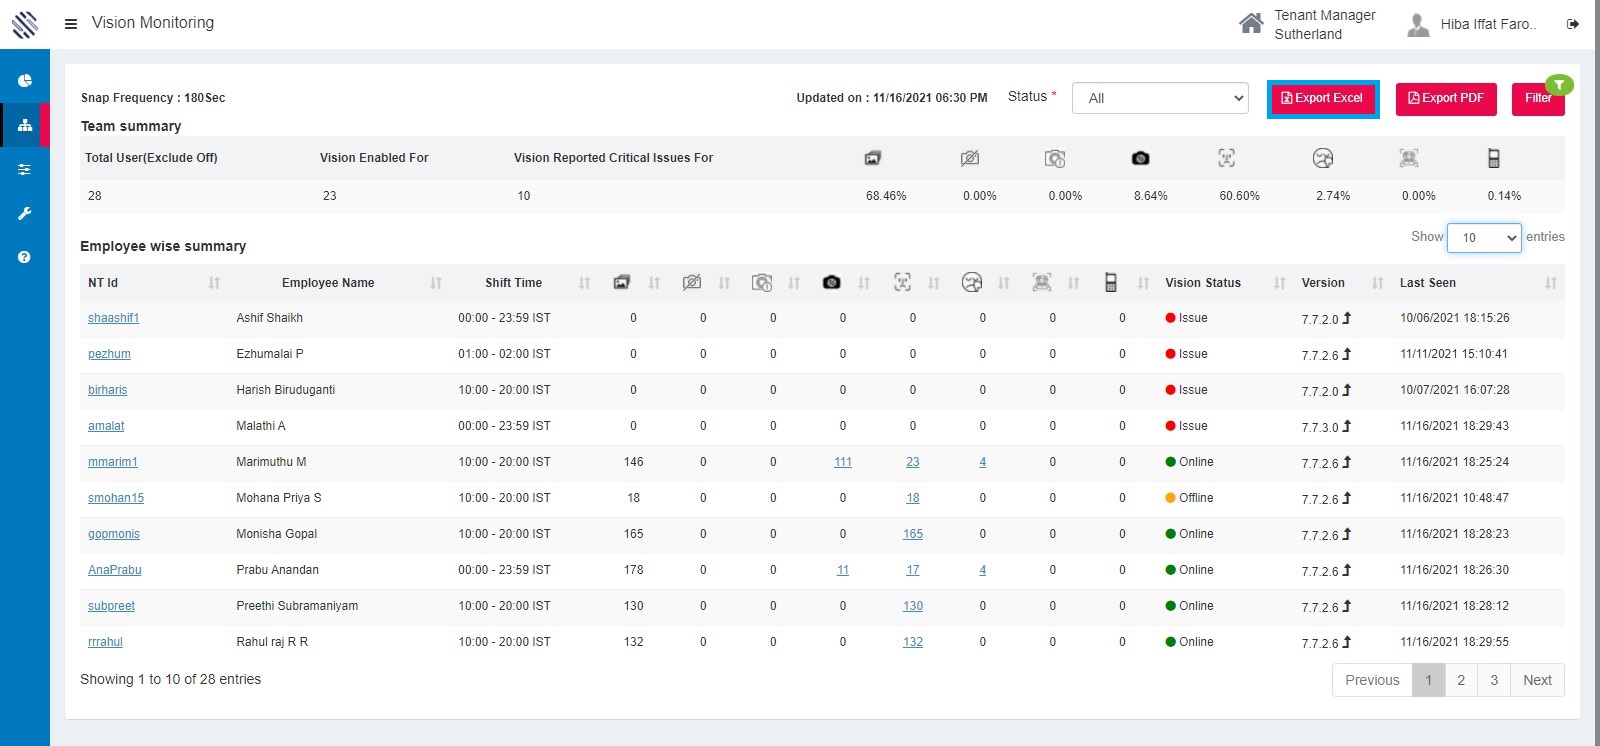
Figure 9
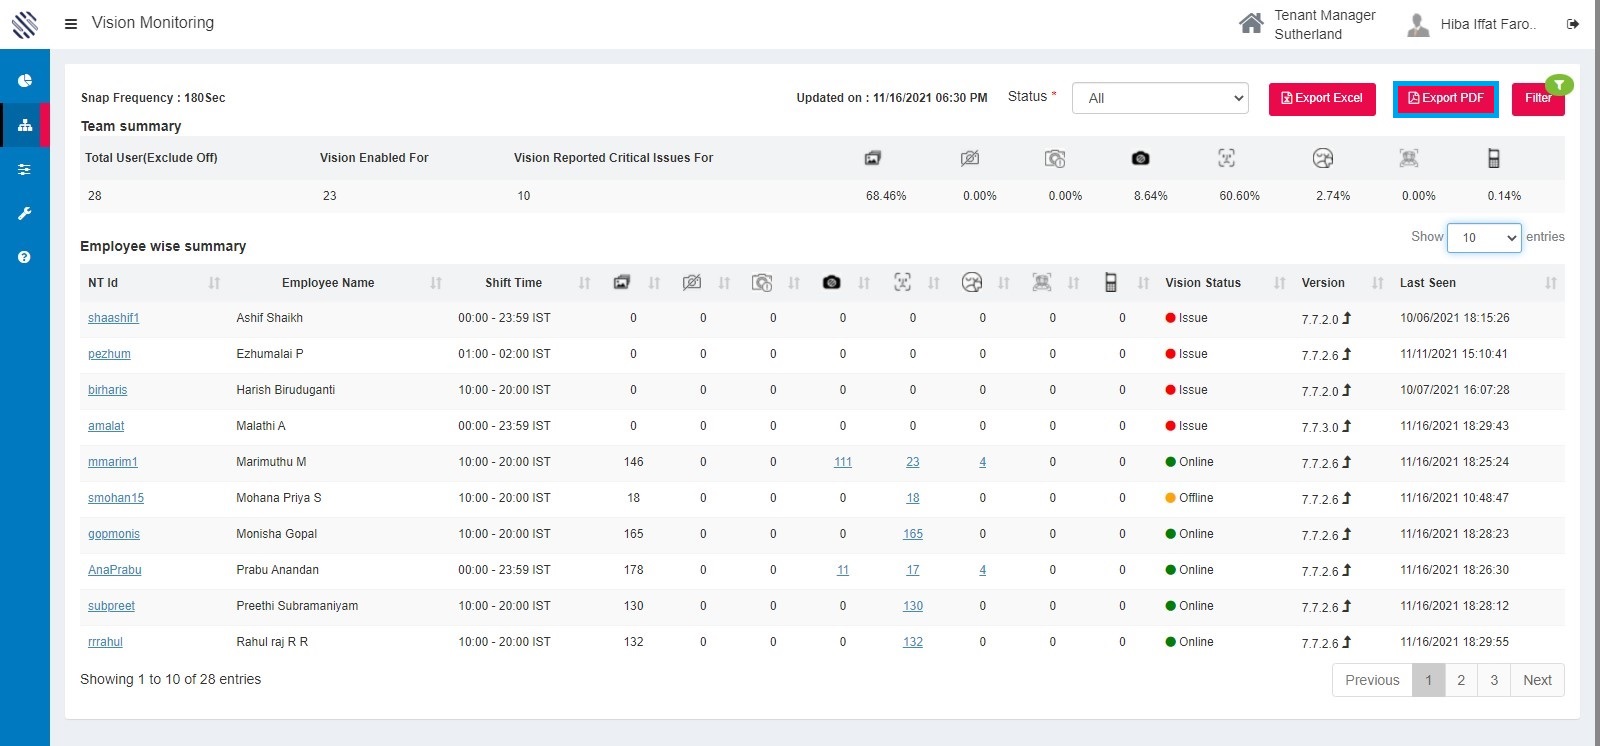
Figure 10
Report Filter:
You can use filters to increase or decrease the scope of data that is being reported.
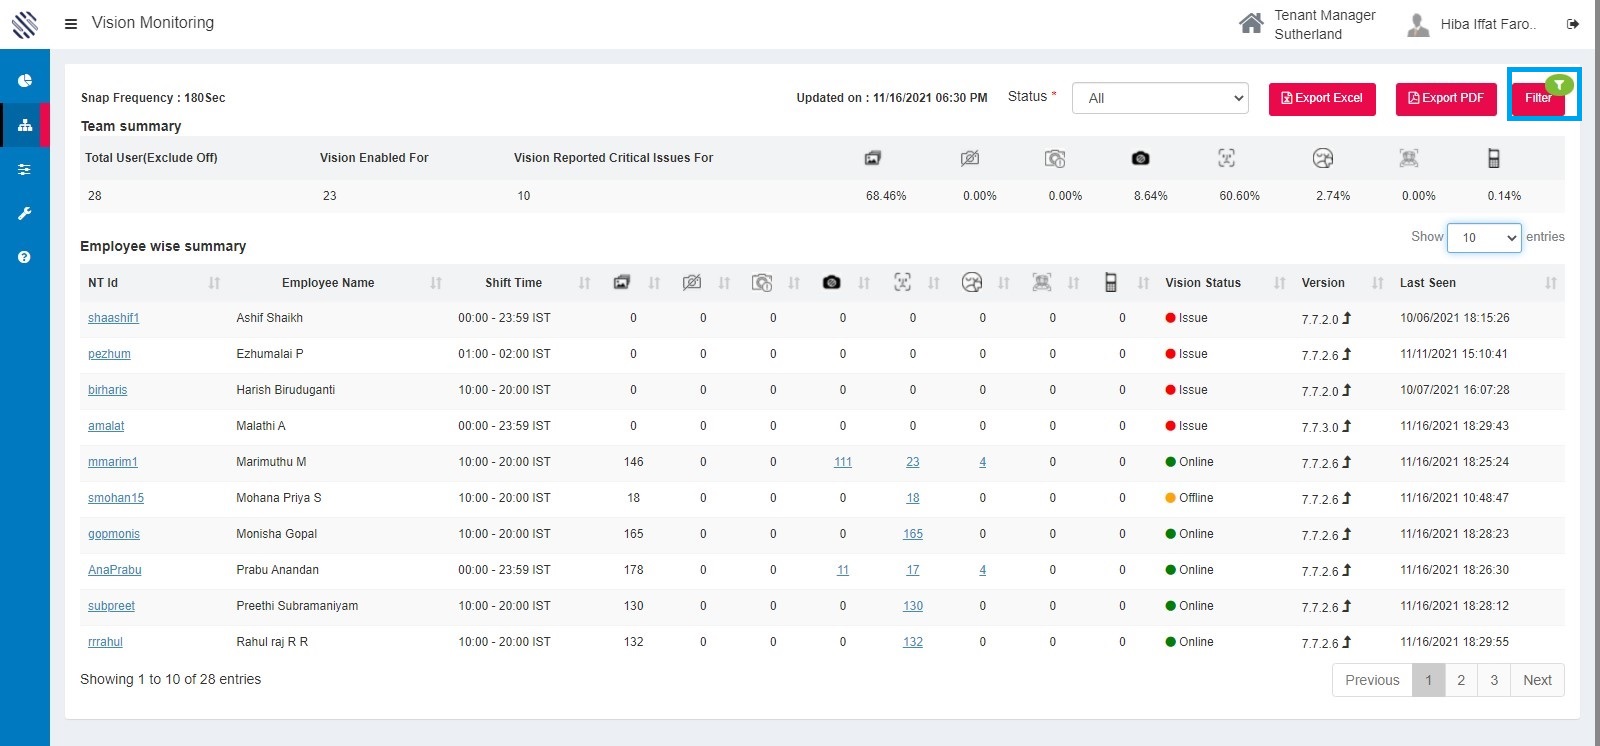
Figure 11
Click on the filter button , a pop – up appears as shown.
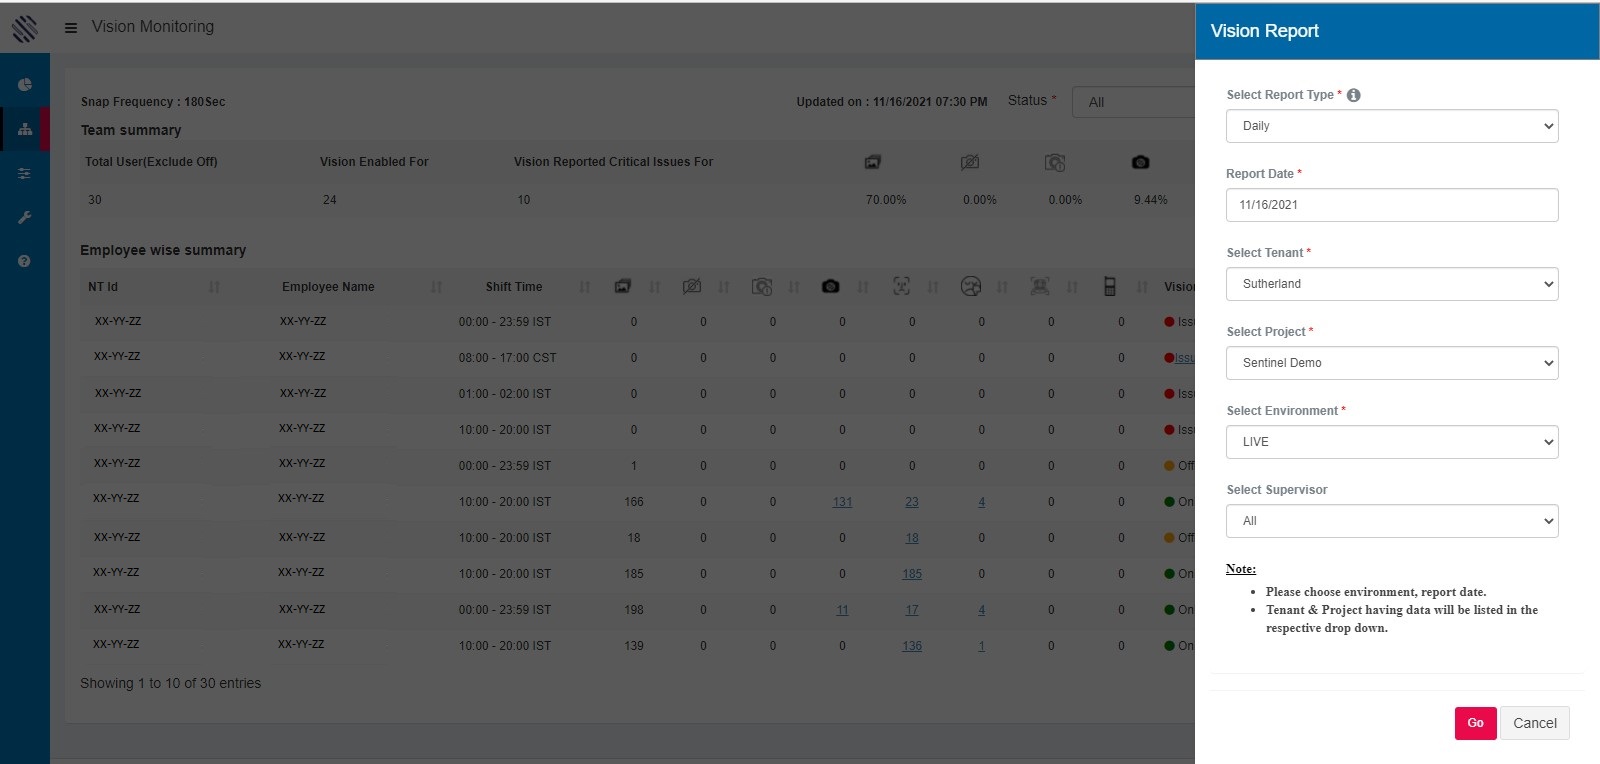
Figure 12
Information: Click on the “i” button to learn more about the anomalies that are reported.
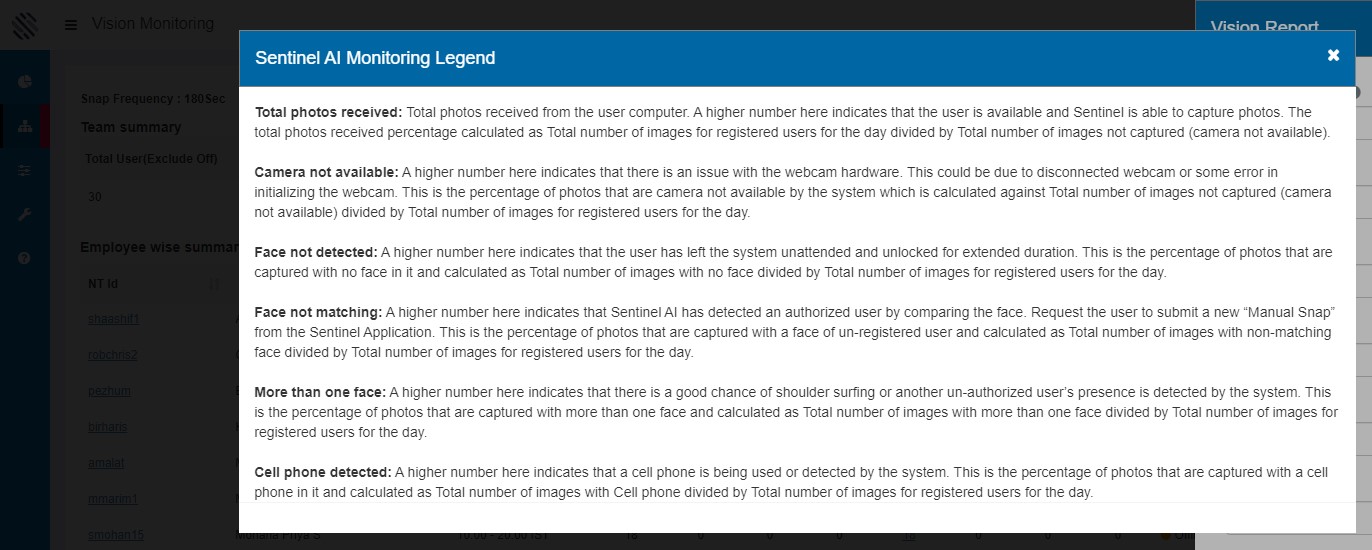
Figure 13
The “select report type” drop down allows you to choose between daily (24 Hours) or custom (90 days) duration for reporting.
Note: Selecting Custome report will bring up an additional date selection field to choose a duration for the report.
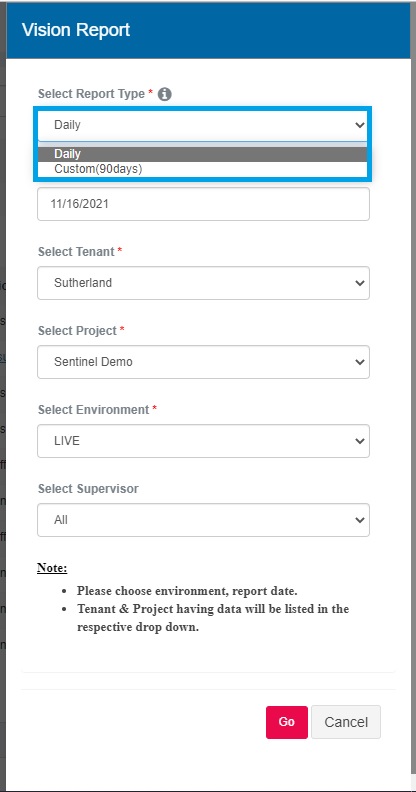
Figure 14
Daily Report - Select, ” report date” from the calendar.
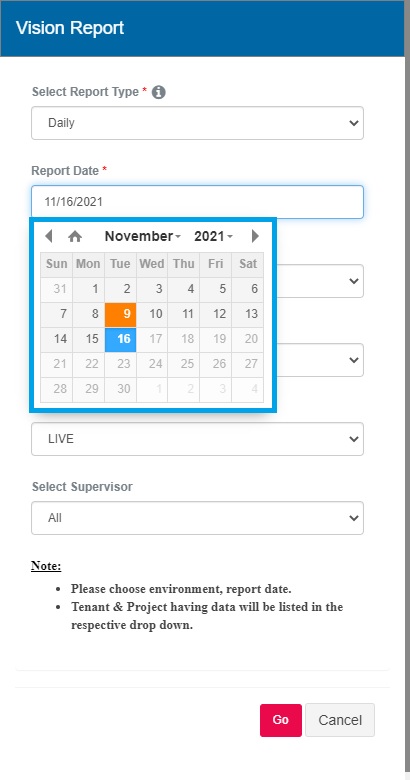
Figure 15
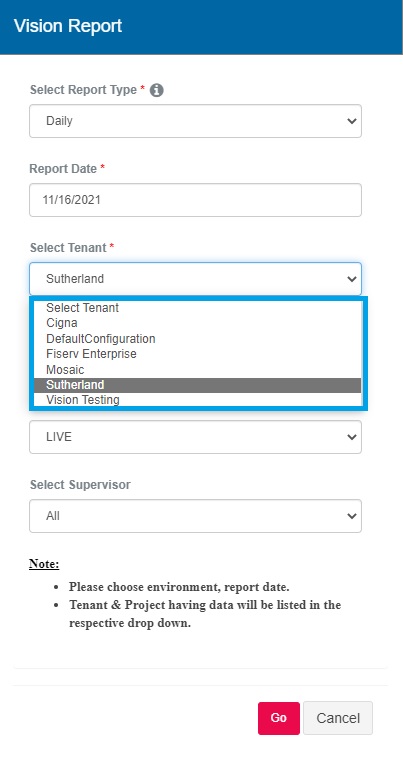
“ Select tenant” drop down, leave it in default. If you have access to other tenants you can use this dropdown.
 s
s
Figure 16
“Select project” , use this to view data for specific project.
If you are not able to change this you may not have access to view data for other projects.
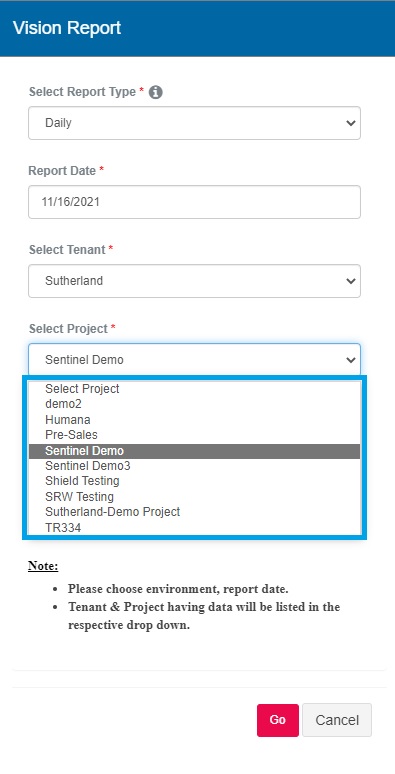
Figure 17
“Select environment”, not editable. For future use. No user action required here.
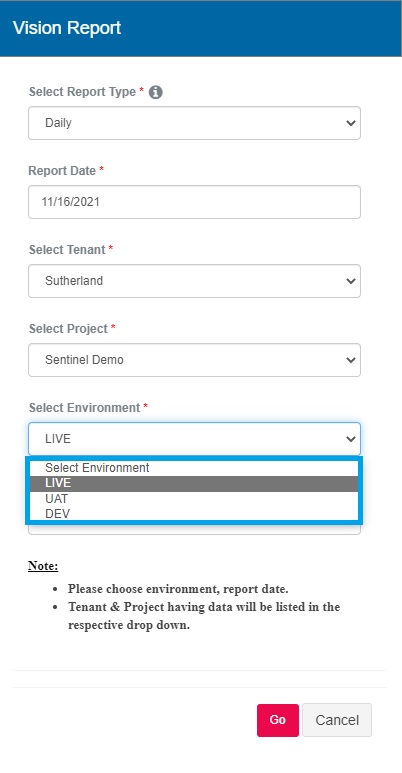
Figure 18
“Select supervisor ” to view anomalies for a specific supervisor. Only Manager will have access to use this filter. For team supervisors this will be a non editable field.
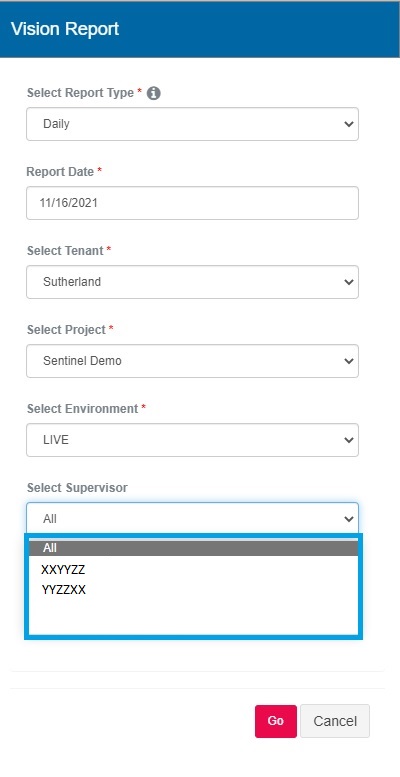
Figure 19
After filtering, click GO.
Vision report in Detail:
Team Summary: Shows the consolidated anomaly percentage for the team or data based on users Filter selection.
Total user (excluded off): This includes number of invited users and registered users on the Sentinel AI platform.
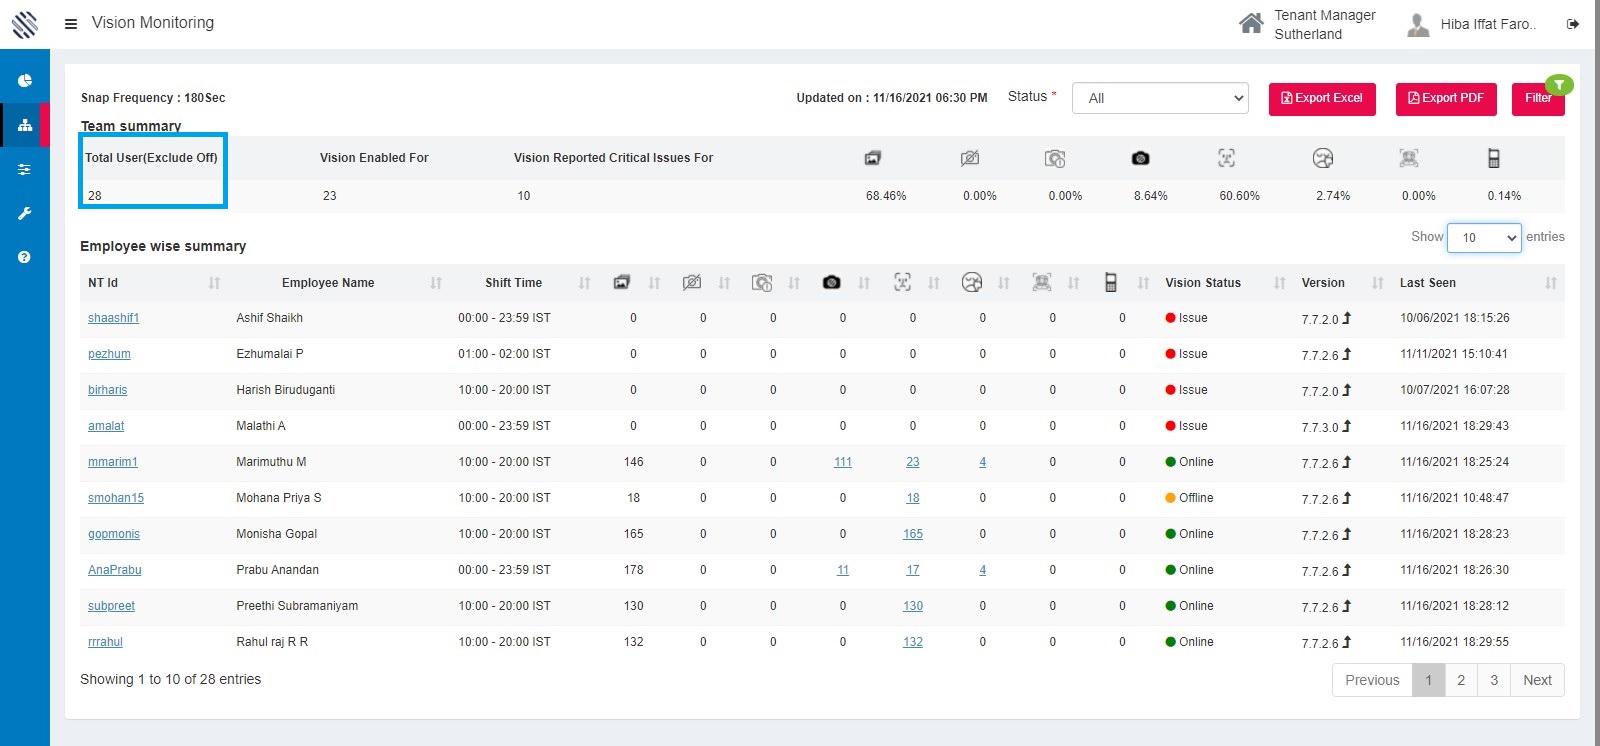
Figure 20
Vision Enabled For: It displays the total number of the users who have completed the Signup process.
Signup: Agreed to the user consent and completed the Vision training process.
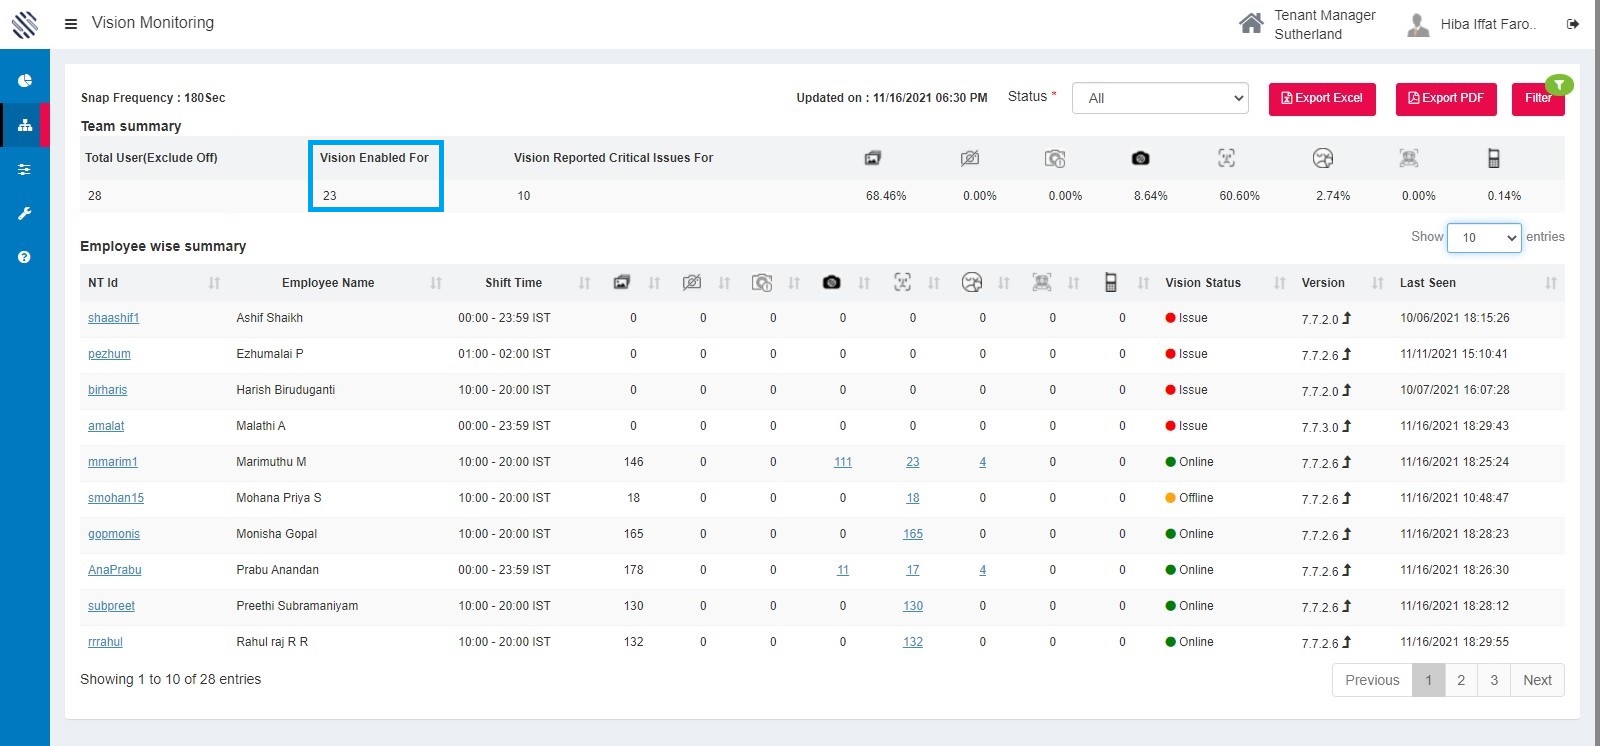
Figure 21
Vision Reported Critical Issues For: It displays the total number of the users for whome no photos have been received in the past 24 hours.
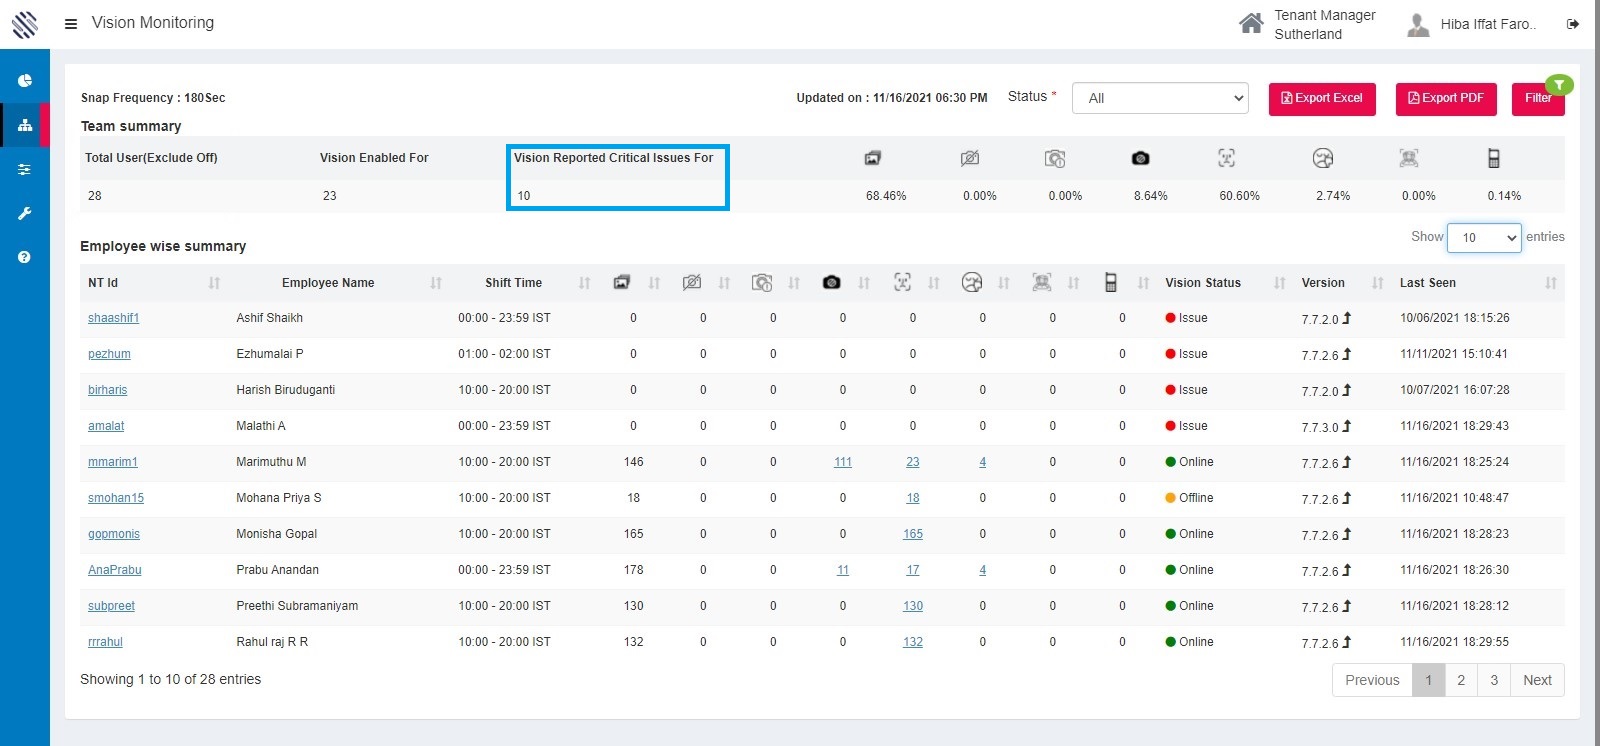
Figure 22
Total photos received:
Total photos receiving from Sentinel.AI Vision app. This will depend on the number of hours users have logged into the system.
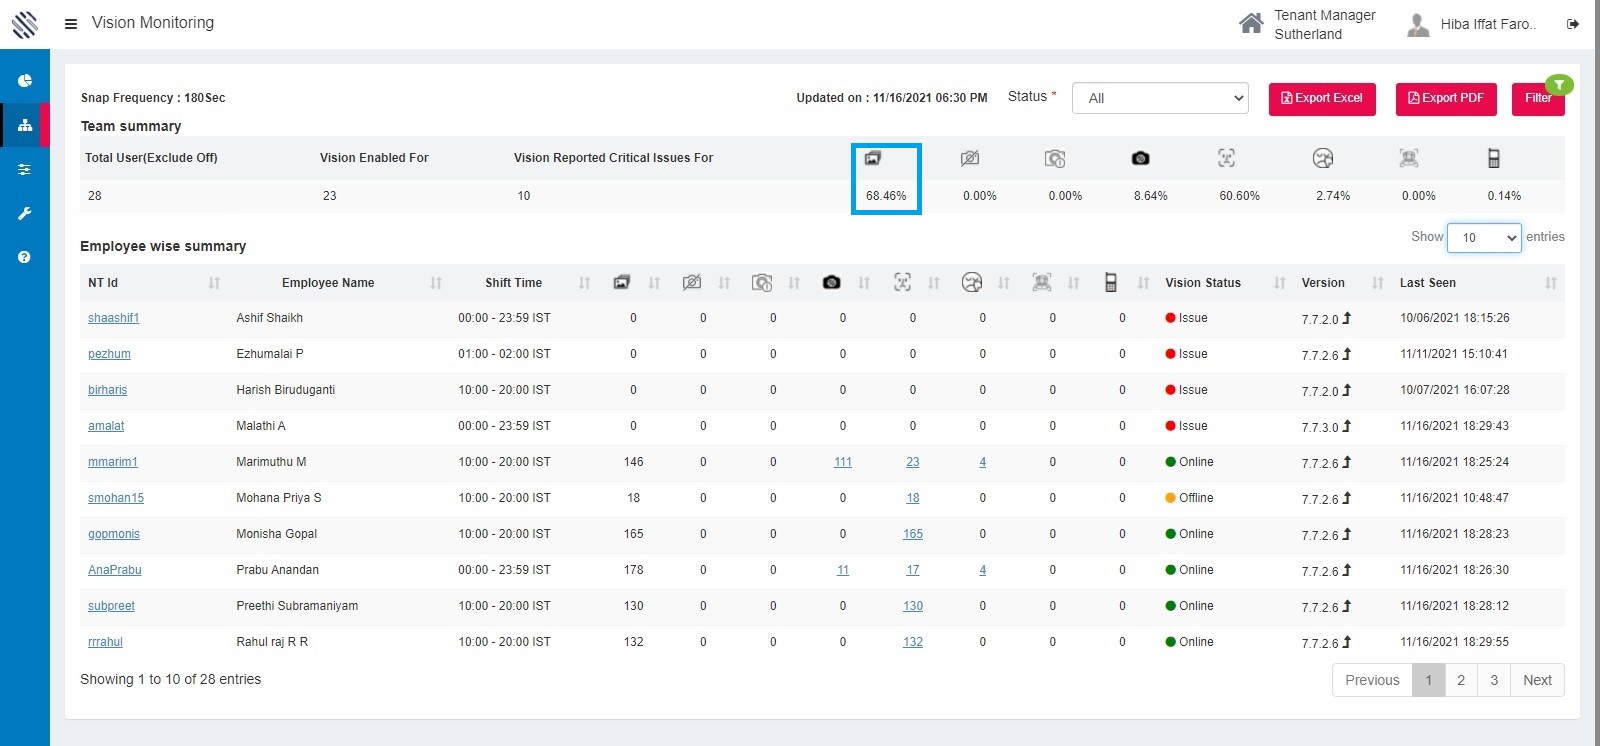
Figure 23
Camera not available:
This occurs when Sentinel AI vision is not able to access the hardware (webcam). This will occur primarily for desktop users where the user can disconnect the webcam from the computer.
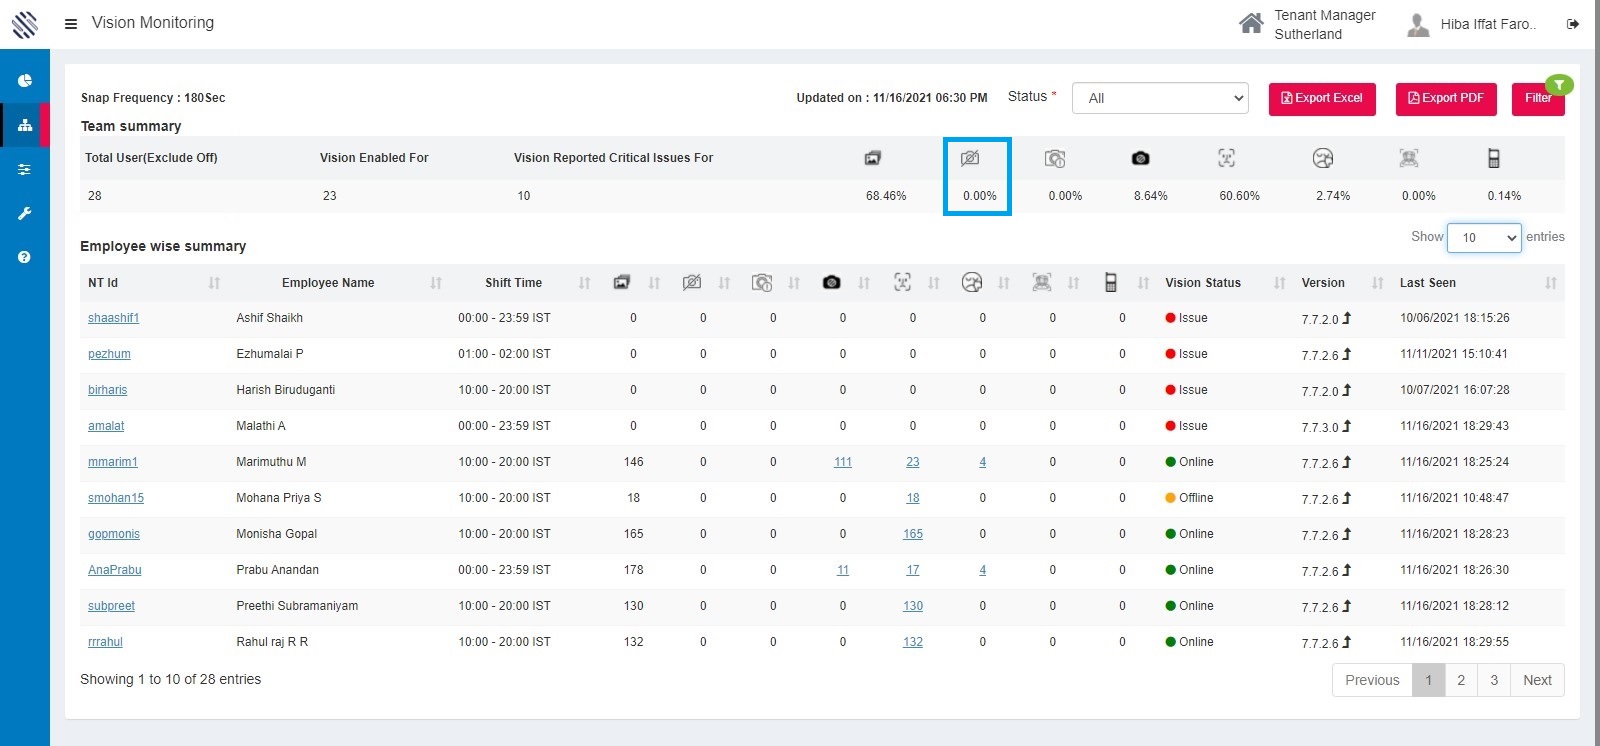
Figure 24
- Camera busy: This is reported when Sentinel.AI is not able to use the camera as it is being used by another application like Webex. Skype, Teams with Video sharing.
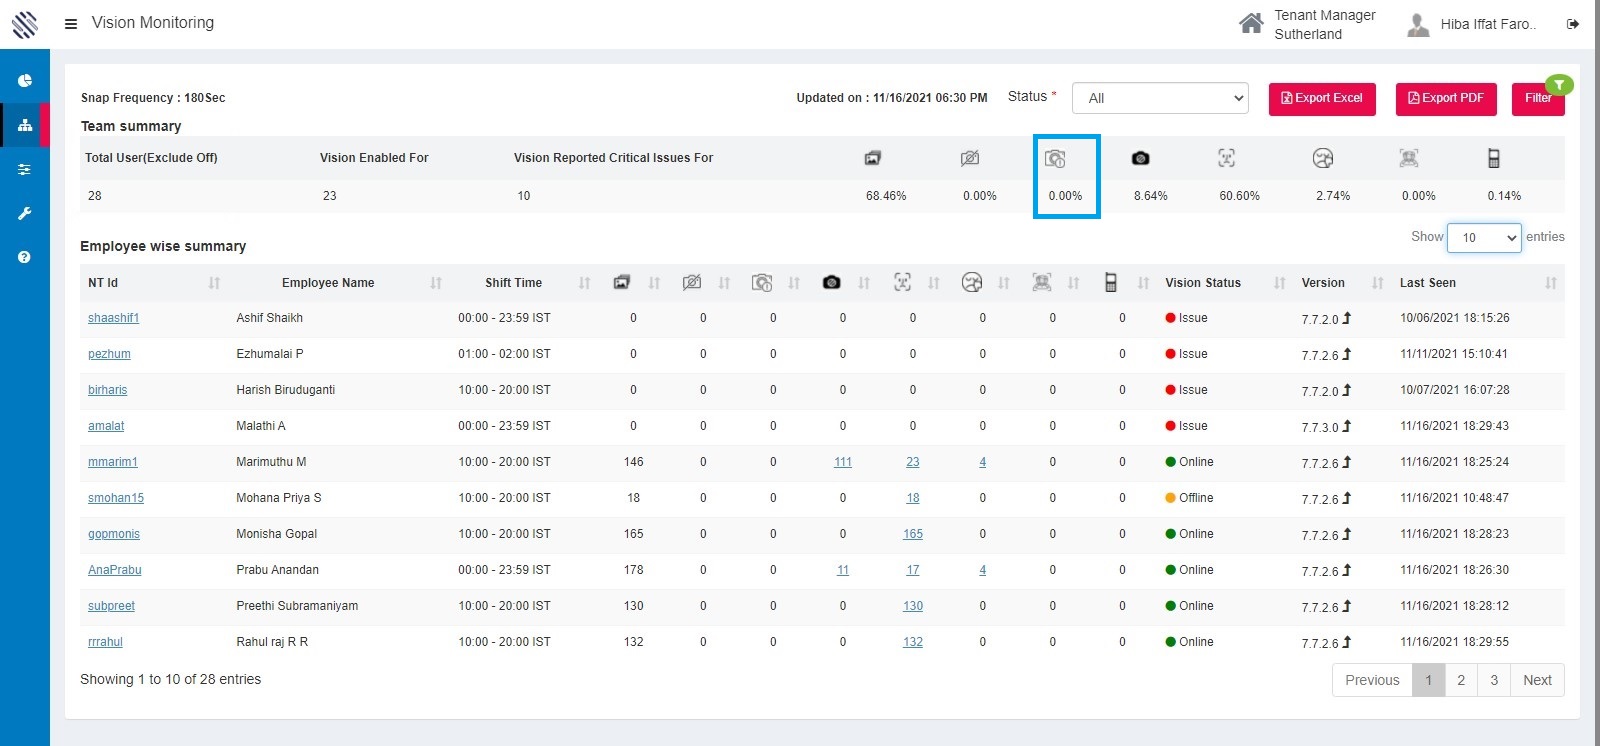
Figure 25
- Lens closed: This is reported when the user has closed or blocked the camera view finder.
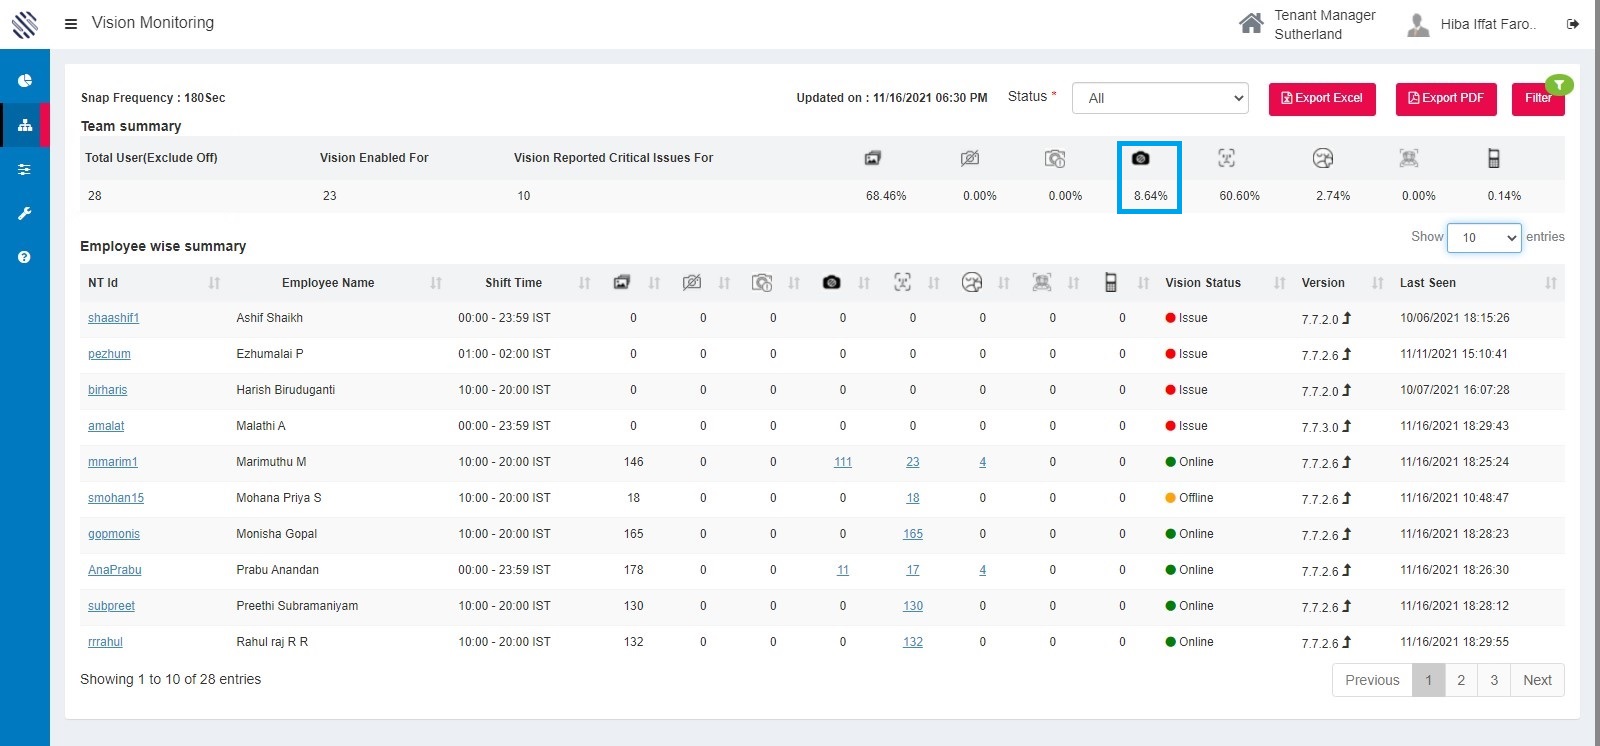
Figure 26
- Face not detected: When Sentinel.AI is not able to identify a face in the captured image this status is reported. Leaving the system unlocked can cause this.
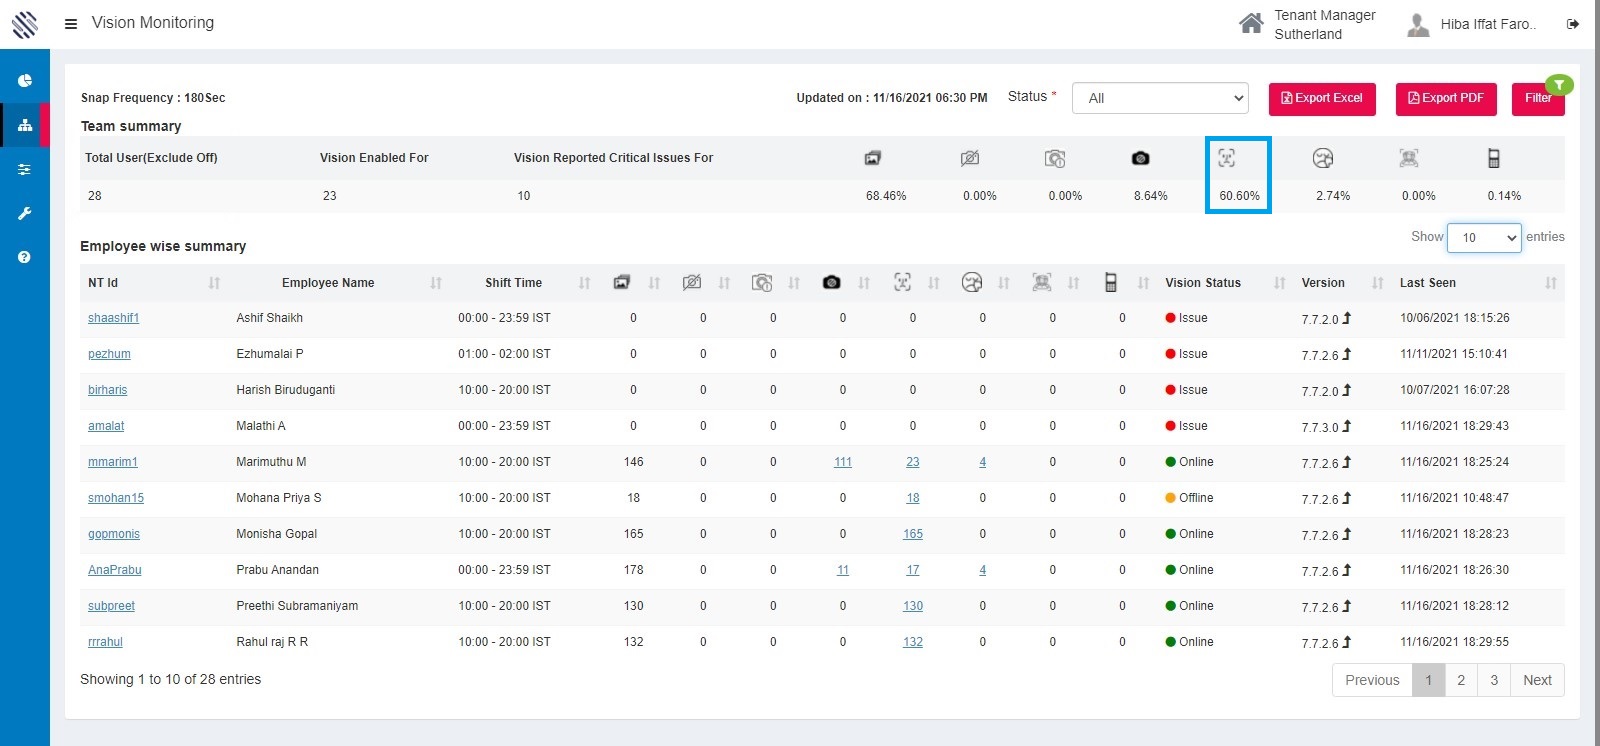
Figure 27
Reviewing Anomalies:
In the Face not Detected field, click on the hyperlinked number or clicking on the any hyperlinked anomaly count for the user.
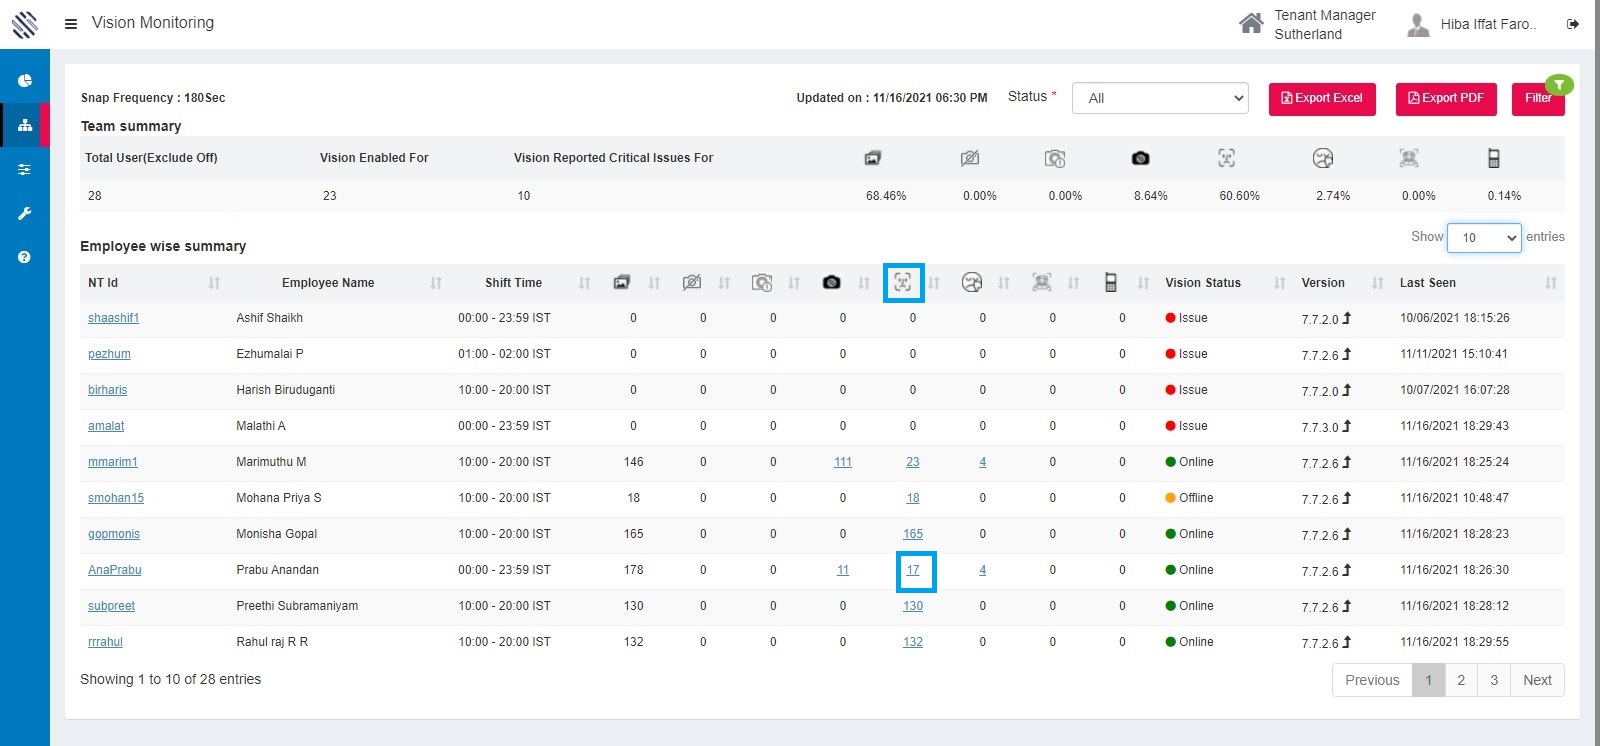
Figure 28
Anomaly review page will be loaded. Users have options to switch the view.
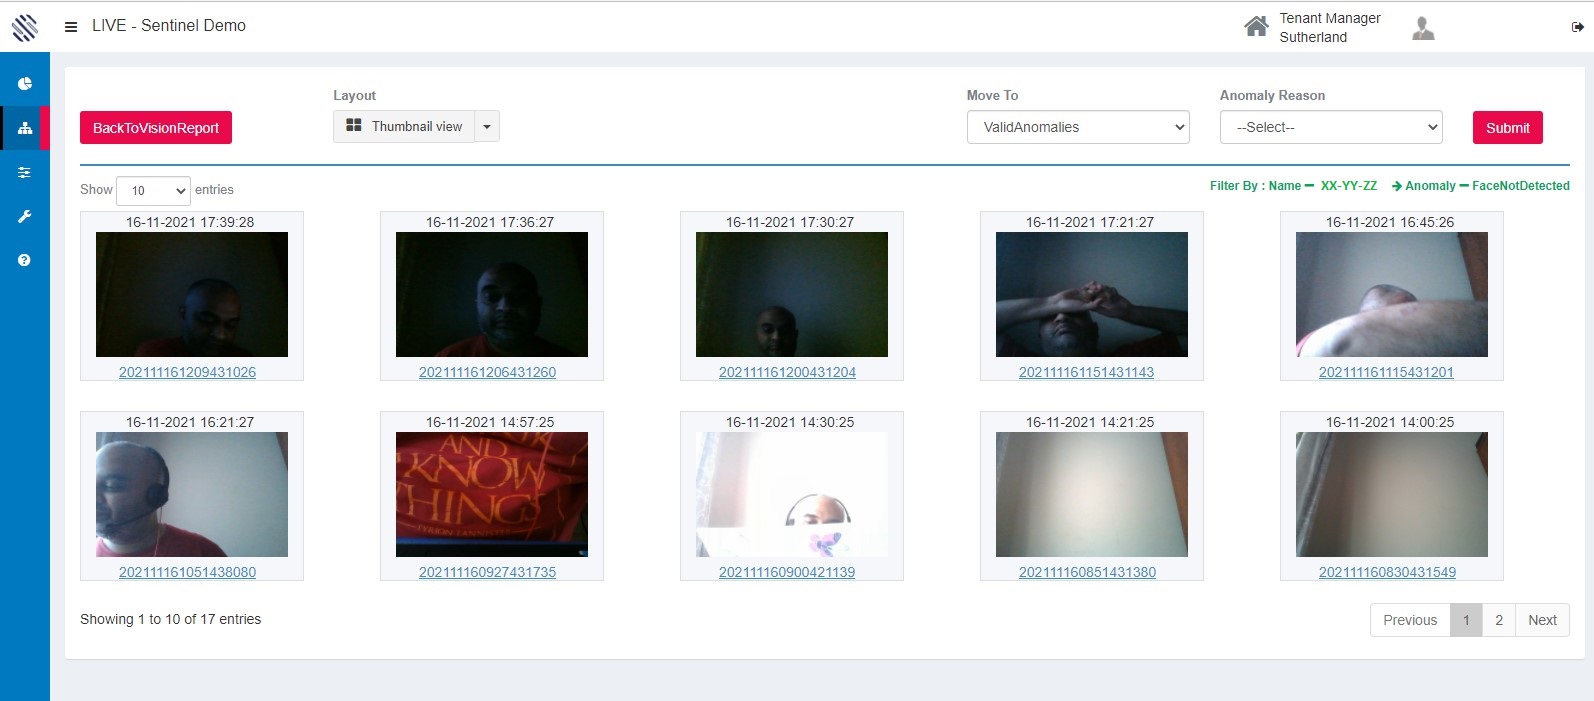
Figure 29
"Thumbnail view" , "Detailed View" and "Normal view" available to review anomlaies.
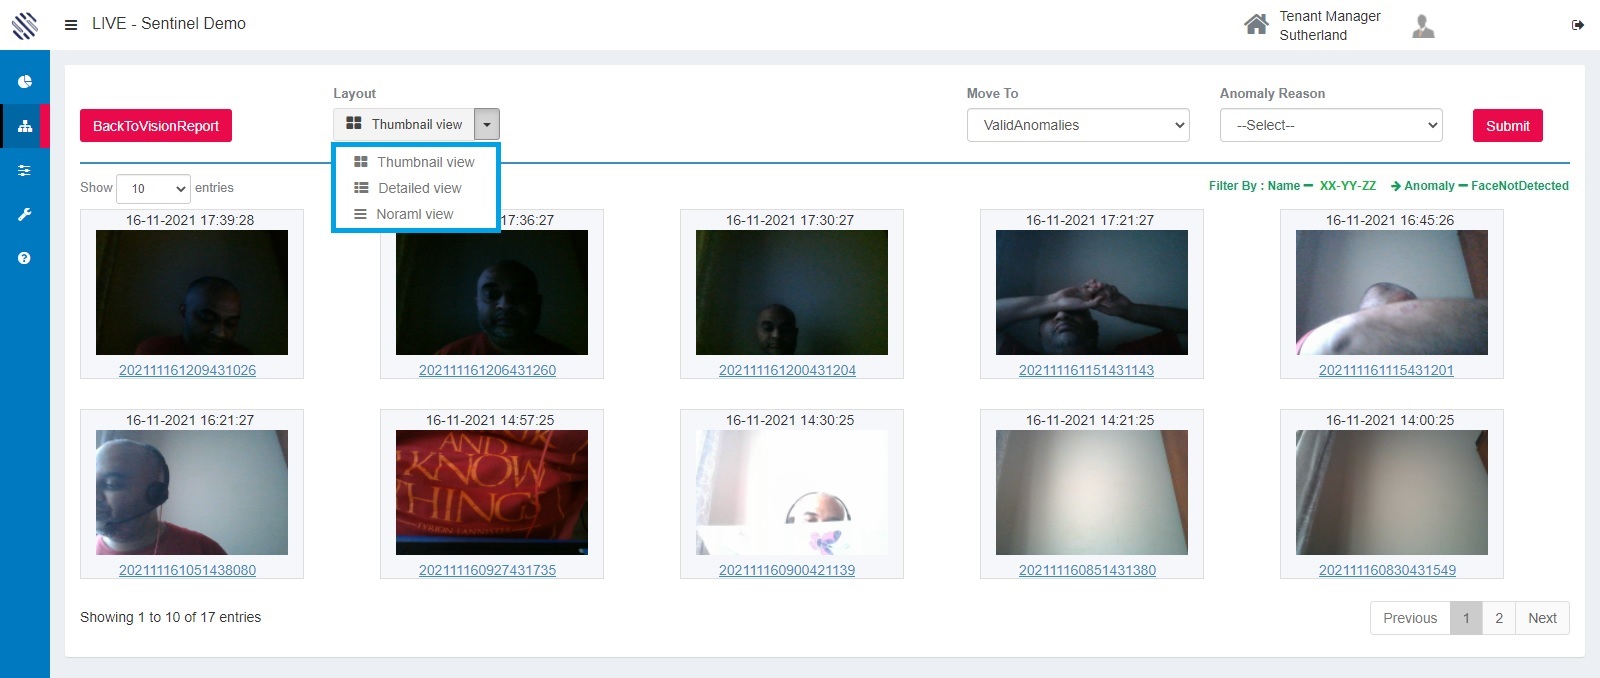
Figure 30
Thumbnail view: Loads thumbnail images for quick anomaly review.
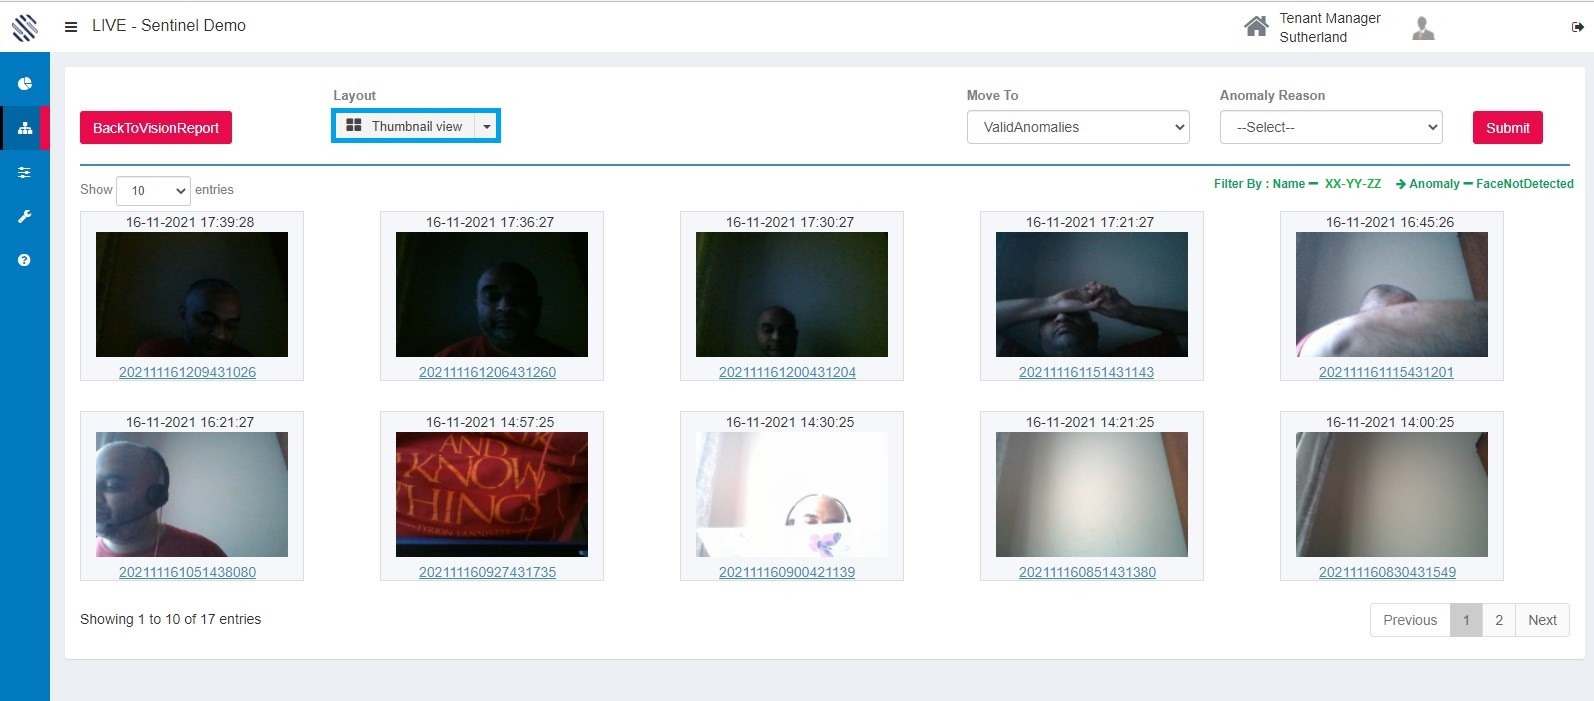
Figure 31
Select any anomaly from the grid. Now, click on the Anomaly reason drop down box to list out the reason for the anomaly and click submit.
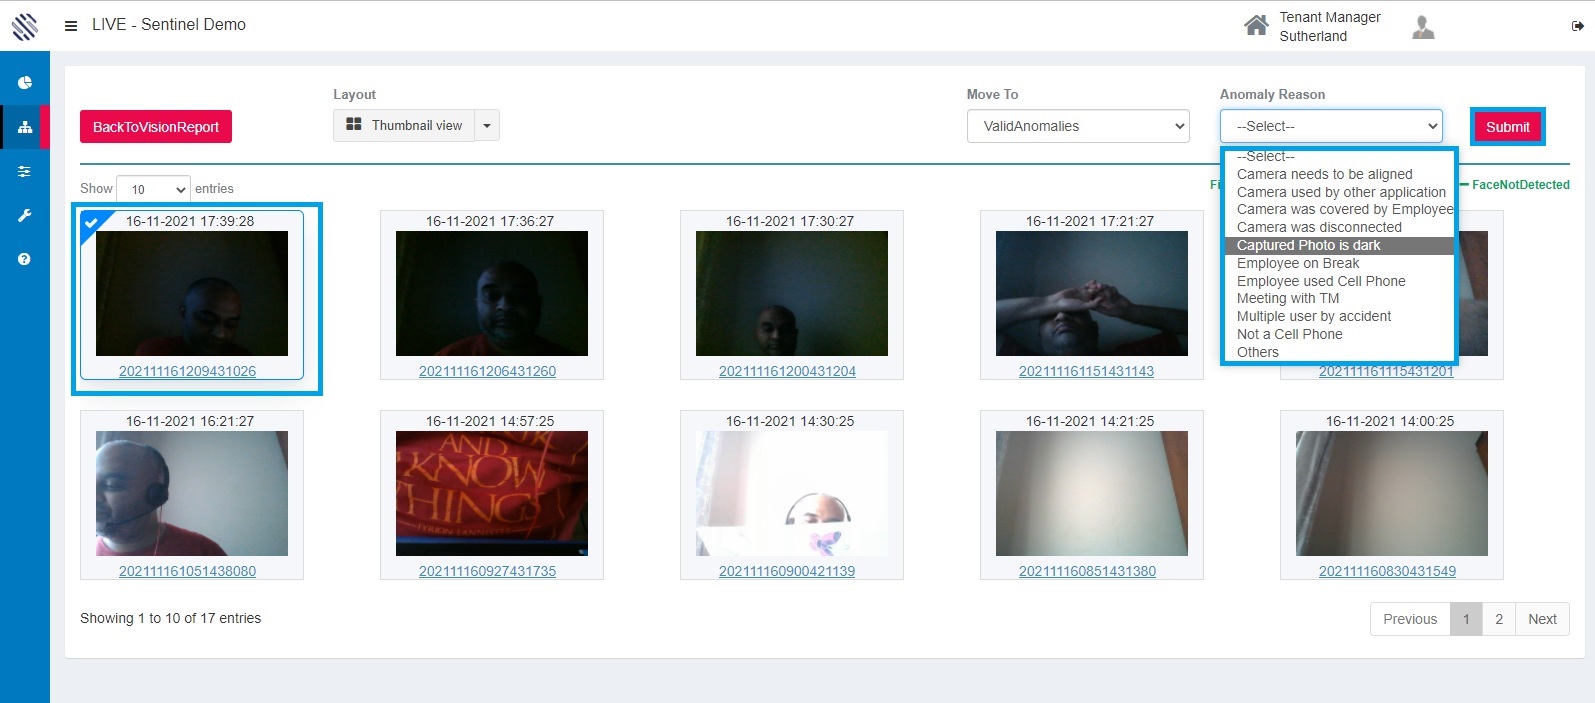
Figure 32
On submission, the review images will be removed from the grid.
Detailed view: Loads thumbnail images with additional information.
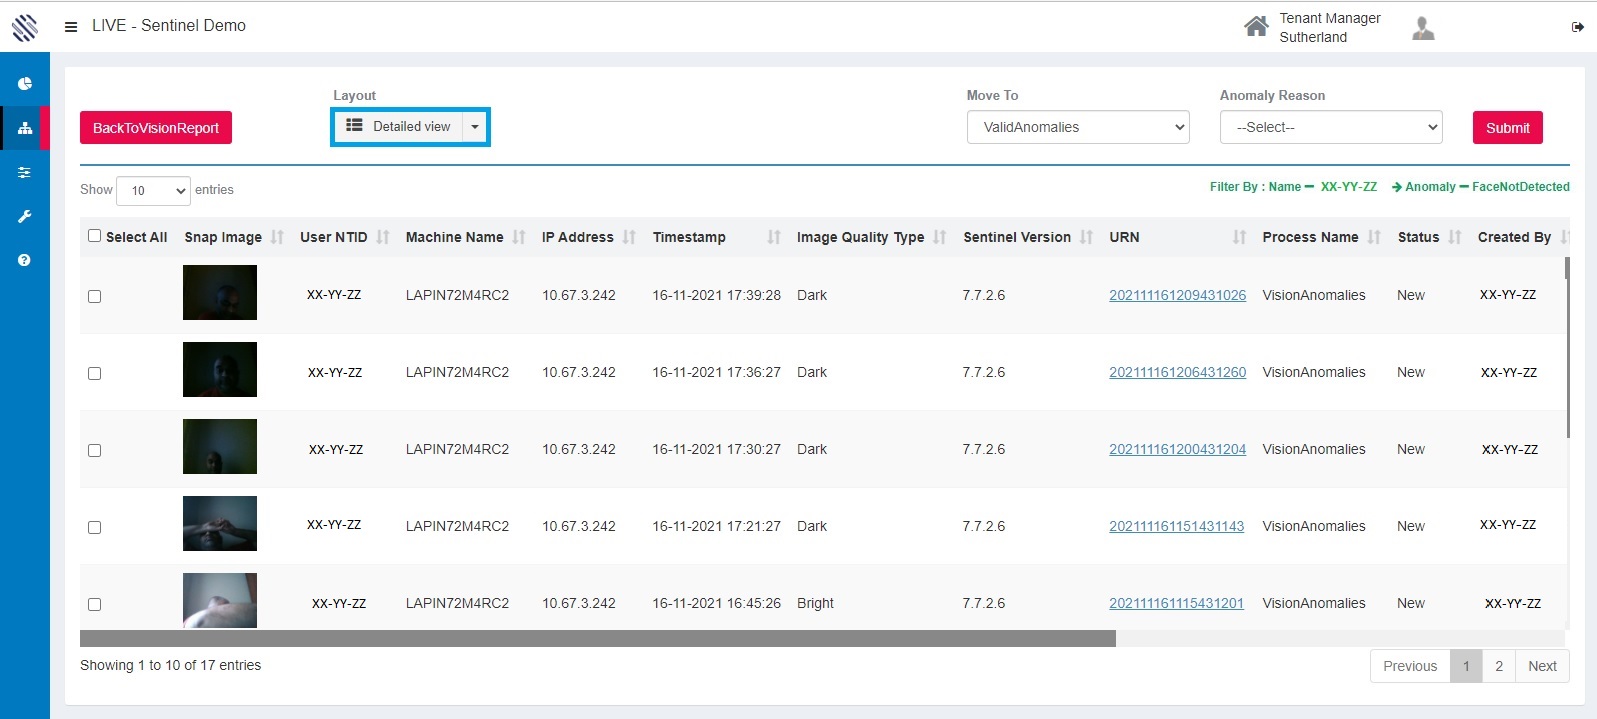
Figure 33
The user can click on check box near to the image to make anumaly submission.
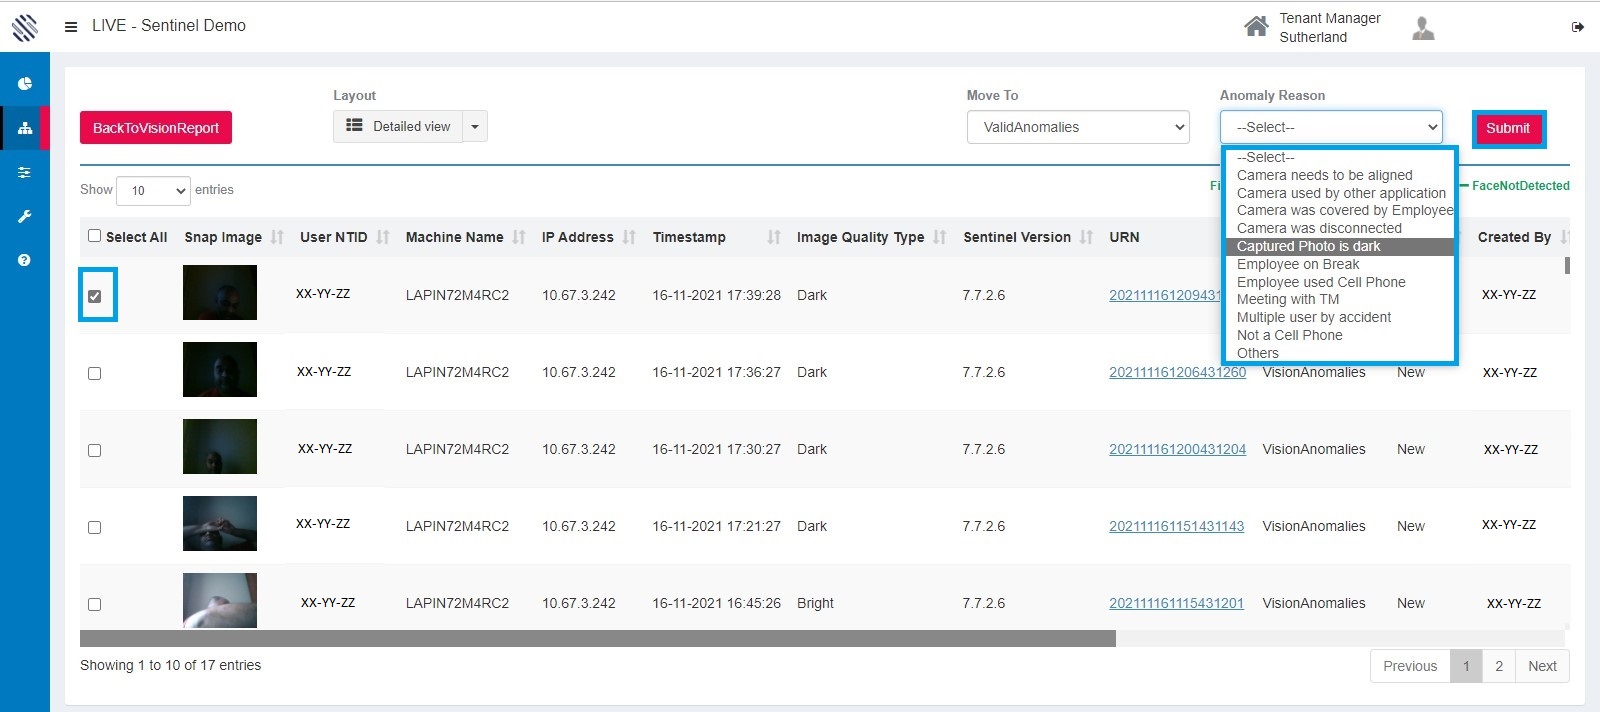
Figure 34
The user can also select the URN hyperlink to analyze the image in detail. The full image will load.
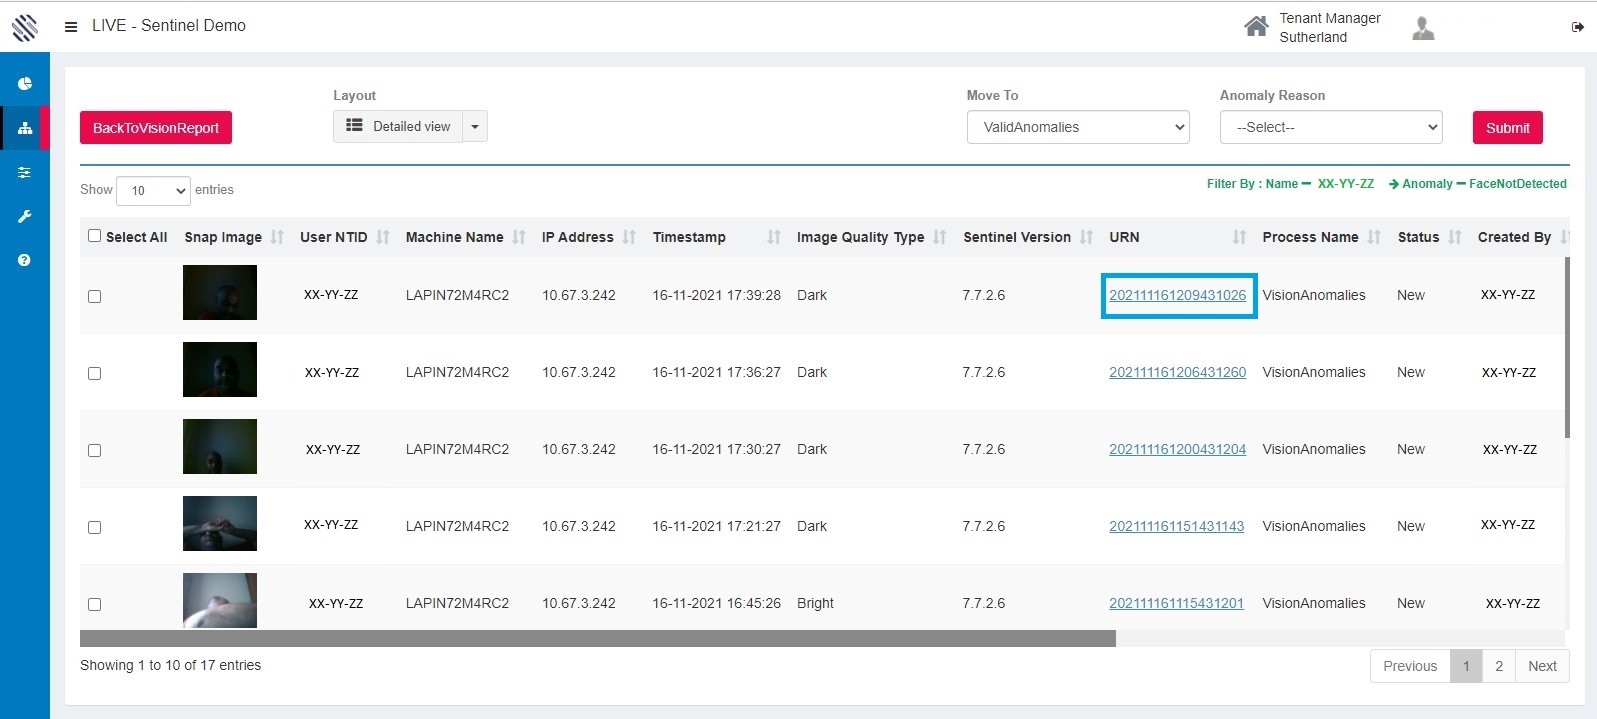
Figure 35
After analyzing the image, the user can give their reason for the anomaly and submit.
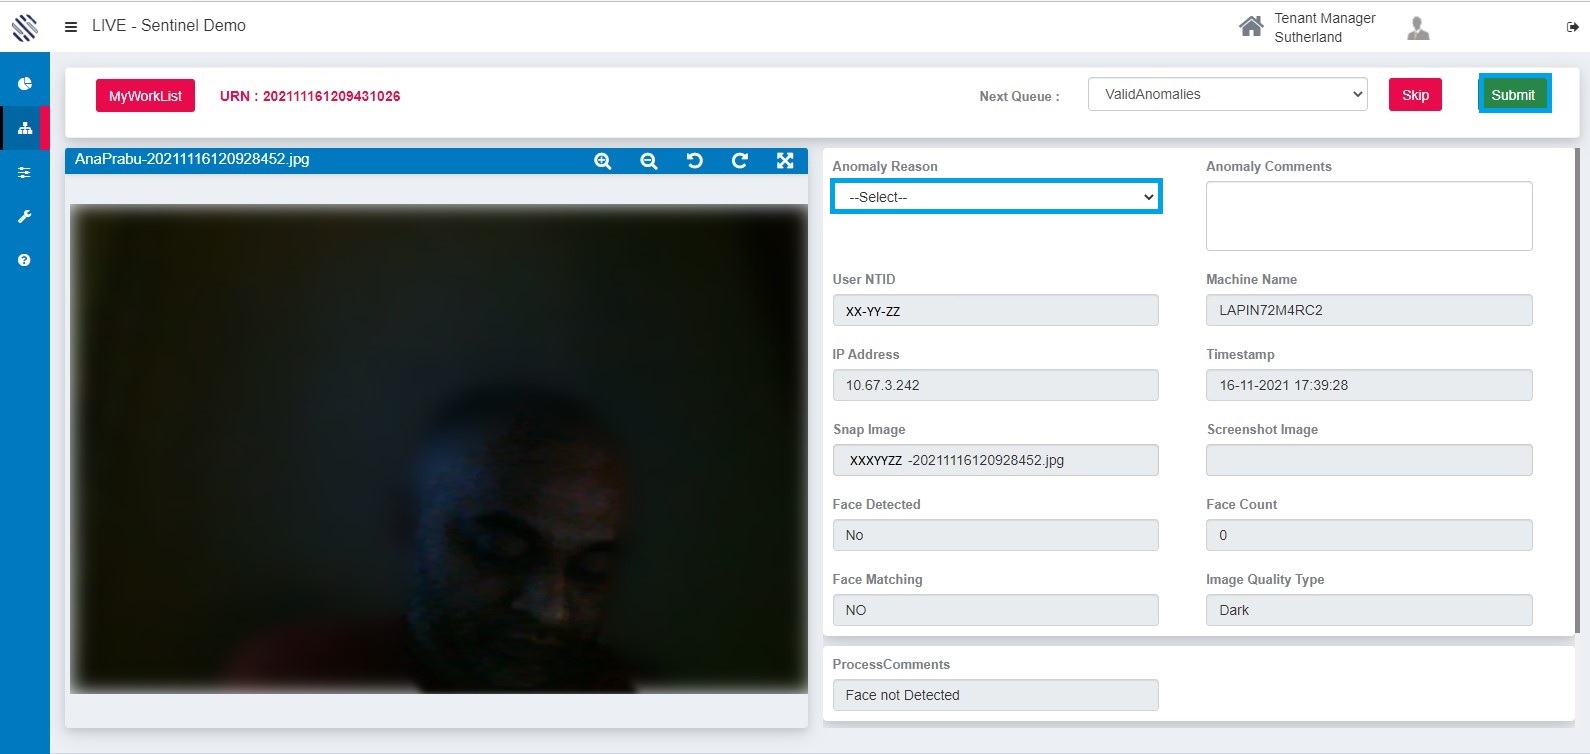
Figure 36
Normal view: The Normal view represents the anomalies in the grid with details. The user have to select the URN and analyze it. No thumbnail image will be displayed in this type of grid view.
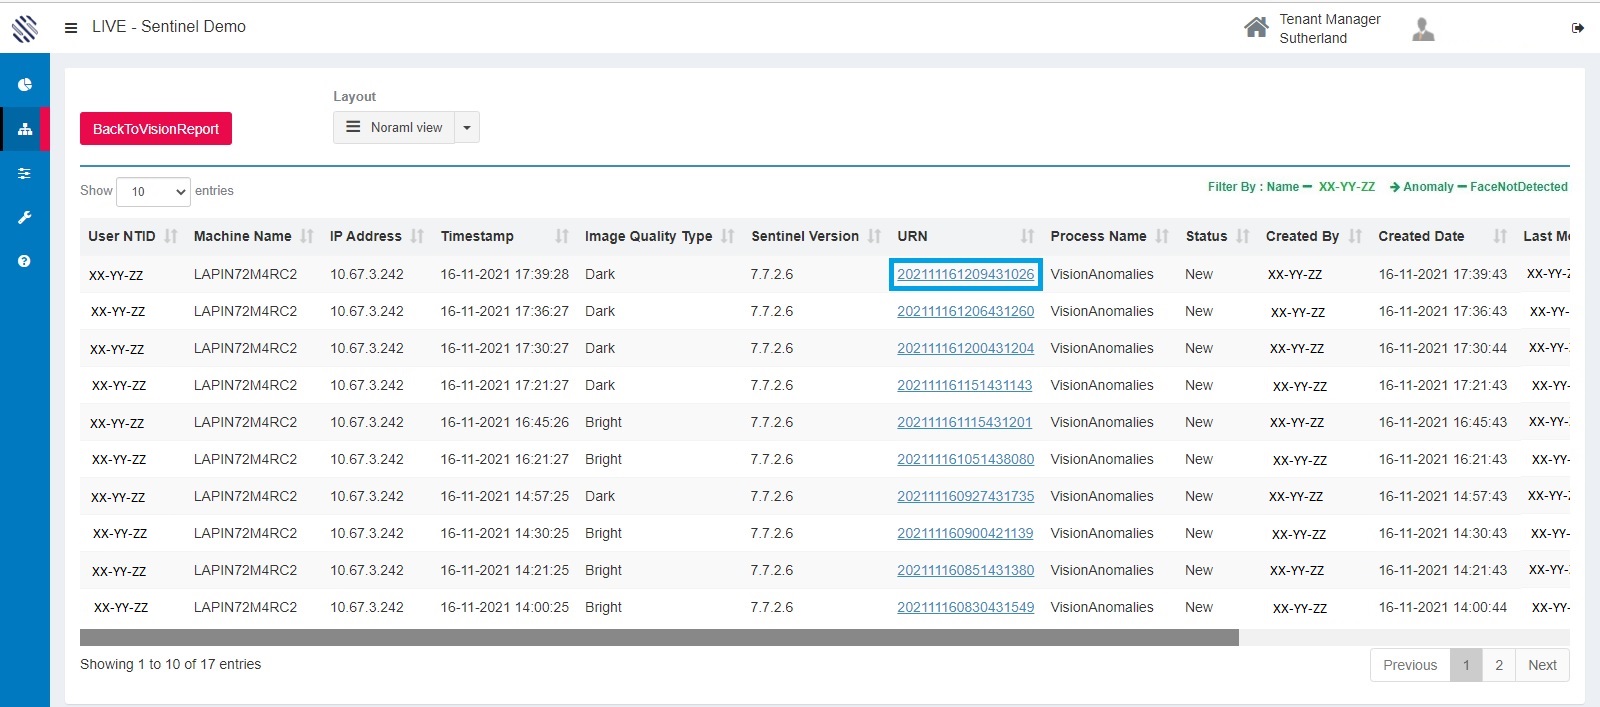
Figure 37
After analyzing the image, the user can provide anomlay reason and submit. The user can also classify the anomaly as valid or invalid anomalies from the next queue drop down.
Selecting the skip button loads the next anomaly image for review.
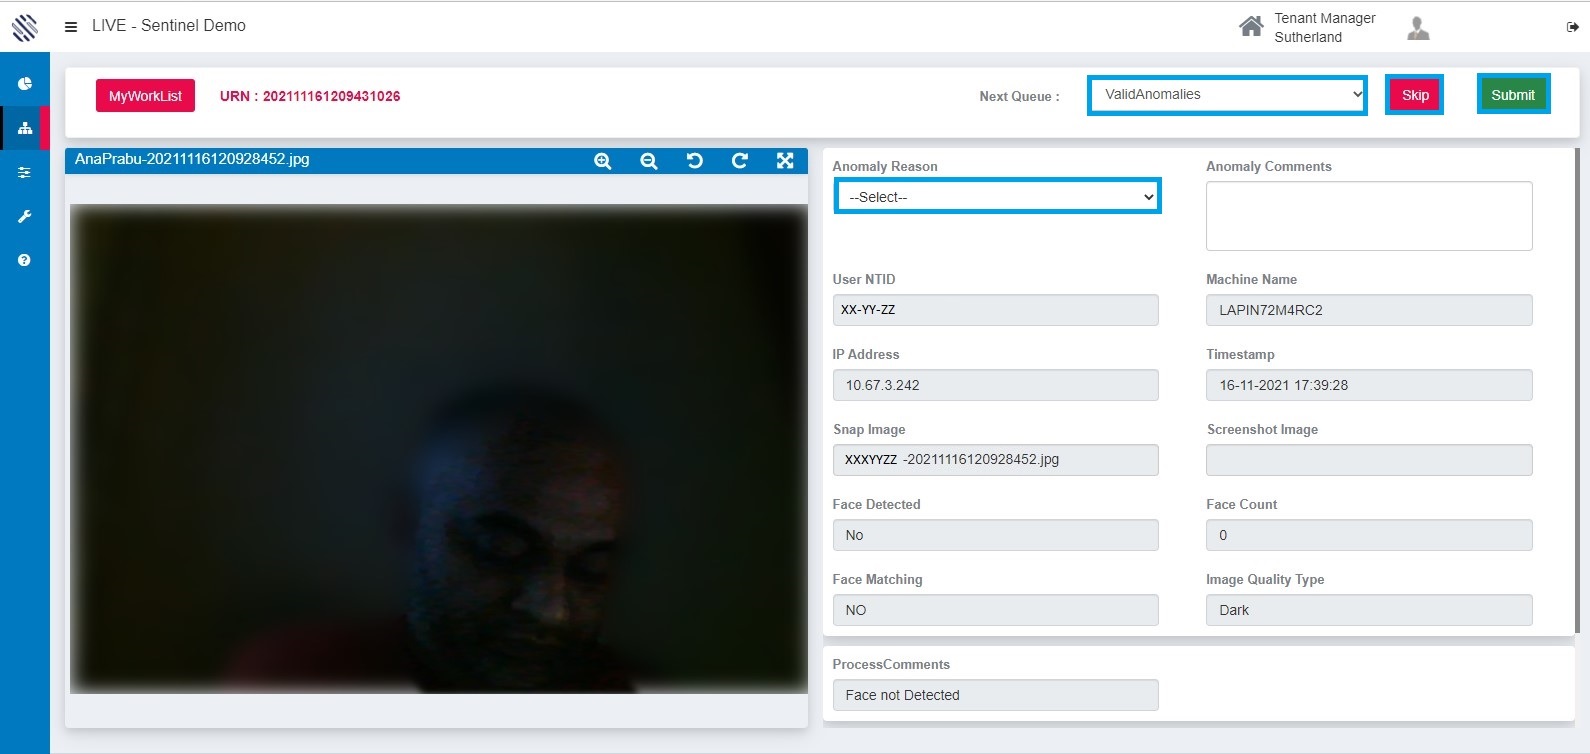
Figure 38
Face not matching:
This is reported when the face registered is not the actual face on the captured image. To avoid this users are advised to lock the system when they are not in the workstation or not share the computers with others in the household.
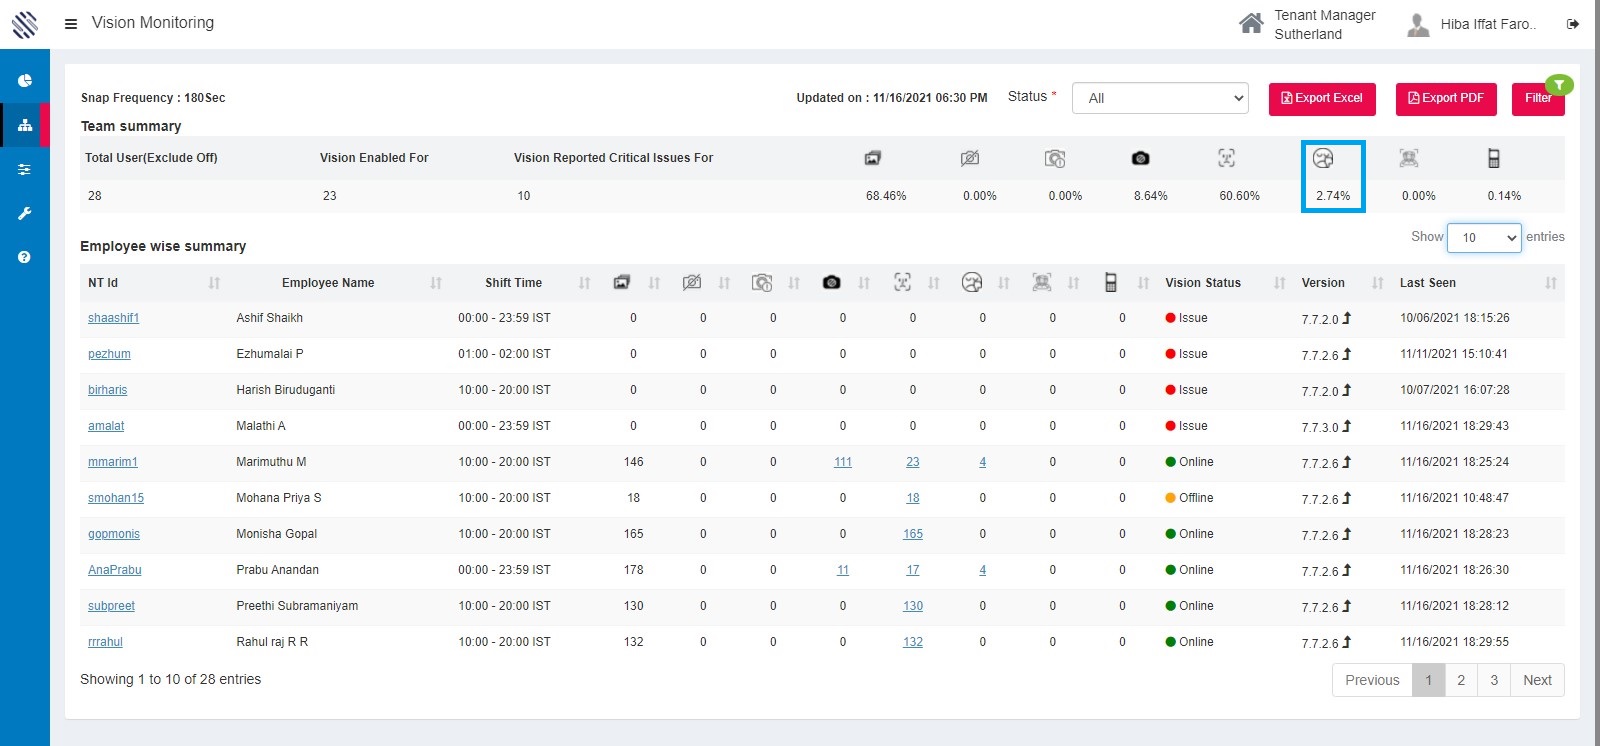
Figure 39
More than one face detected:
A higher number here indicates that there is a good chance of shoulder surfing, or another un-authorized user’s presence is detected by Sentinel.AI
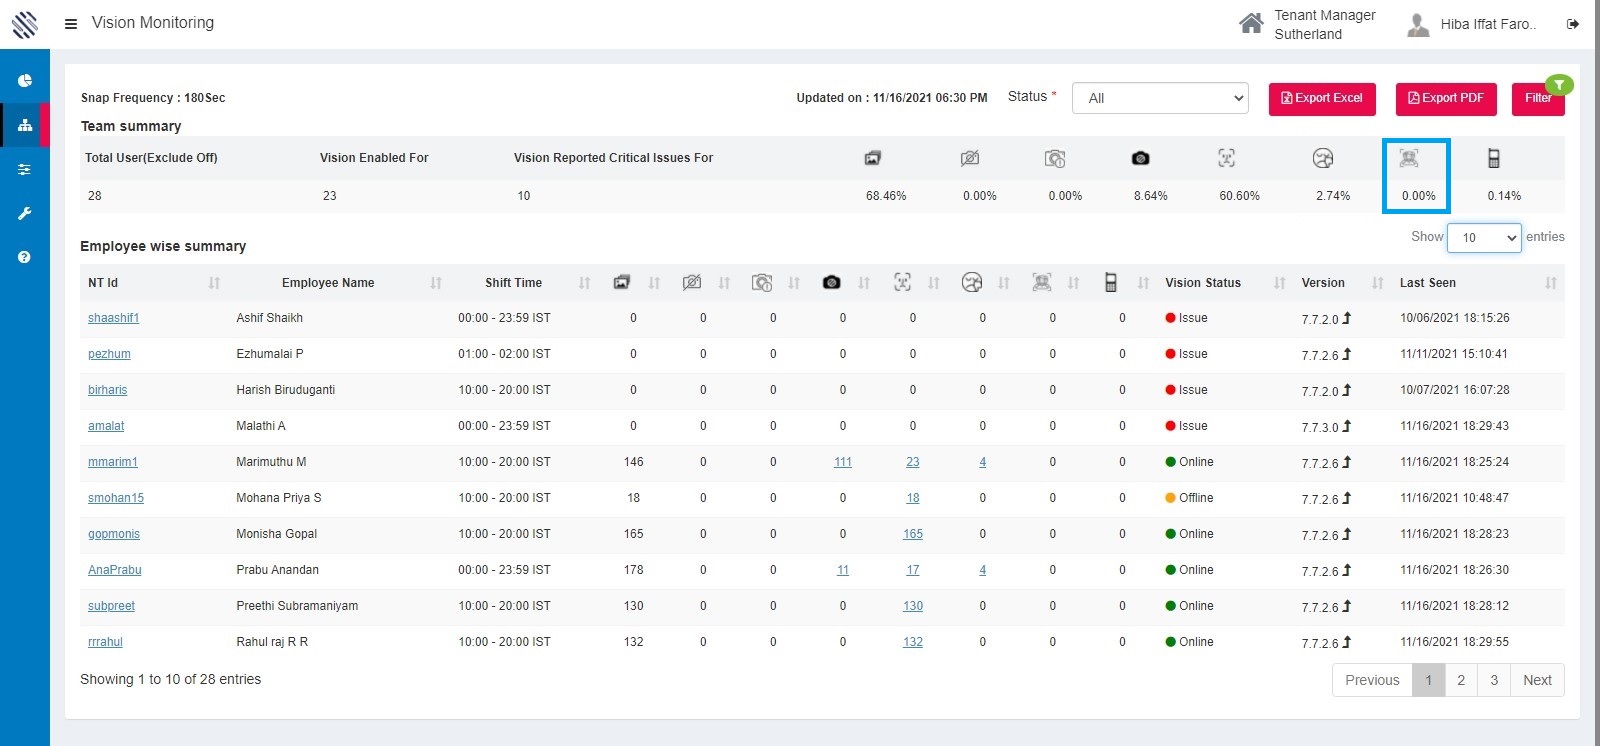
Figure 40
The Vision report provides a view for supervisors to monitor anomalies that are reported for their respective team members. Additionally there are options to filter the duration of reporting between daily or they can choose a
Important: The user list with supervisor mapping, shift duration and week offs have to be correctly updated for vision report to work. Please refer masterdata configuration link for help.
Report Calculation:
Total Photos Received = Total Photos actually received divided by the estimated photos gives the total photos received percentage.
Total estimated photos = Number of users multiplied by snap frequency and 8 hours (Ideal shift duration).
Photos not Received = Total “Camera Not Available” anomalies for team members scheduled to work divided by total estimated photos for the team.
Face not Detected = Total of “Face not Detected” anomalies for the team members scheduled to work divided by total photos actually received.
Face not Matching = Total of “Face not Matching” anomalies for the team members scheduled to work divided by total photos actually received.
More then one Face = Total of “More than one Face” anomalies for team members scheduled to work divided by total photos actually received.
Cell phone detected = Total of “Cell phone detected” anomalies for team members scheduled to work divided by Total photos actually received.